01 · Einführung und Lernpfad
kohorte_ueberblick.png
Abbildung · Quellcode
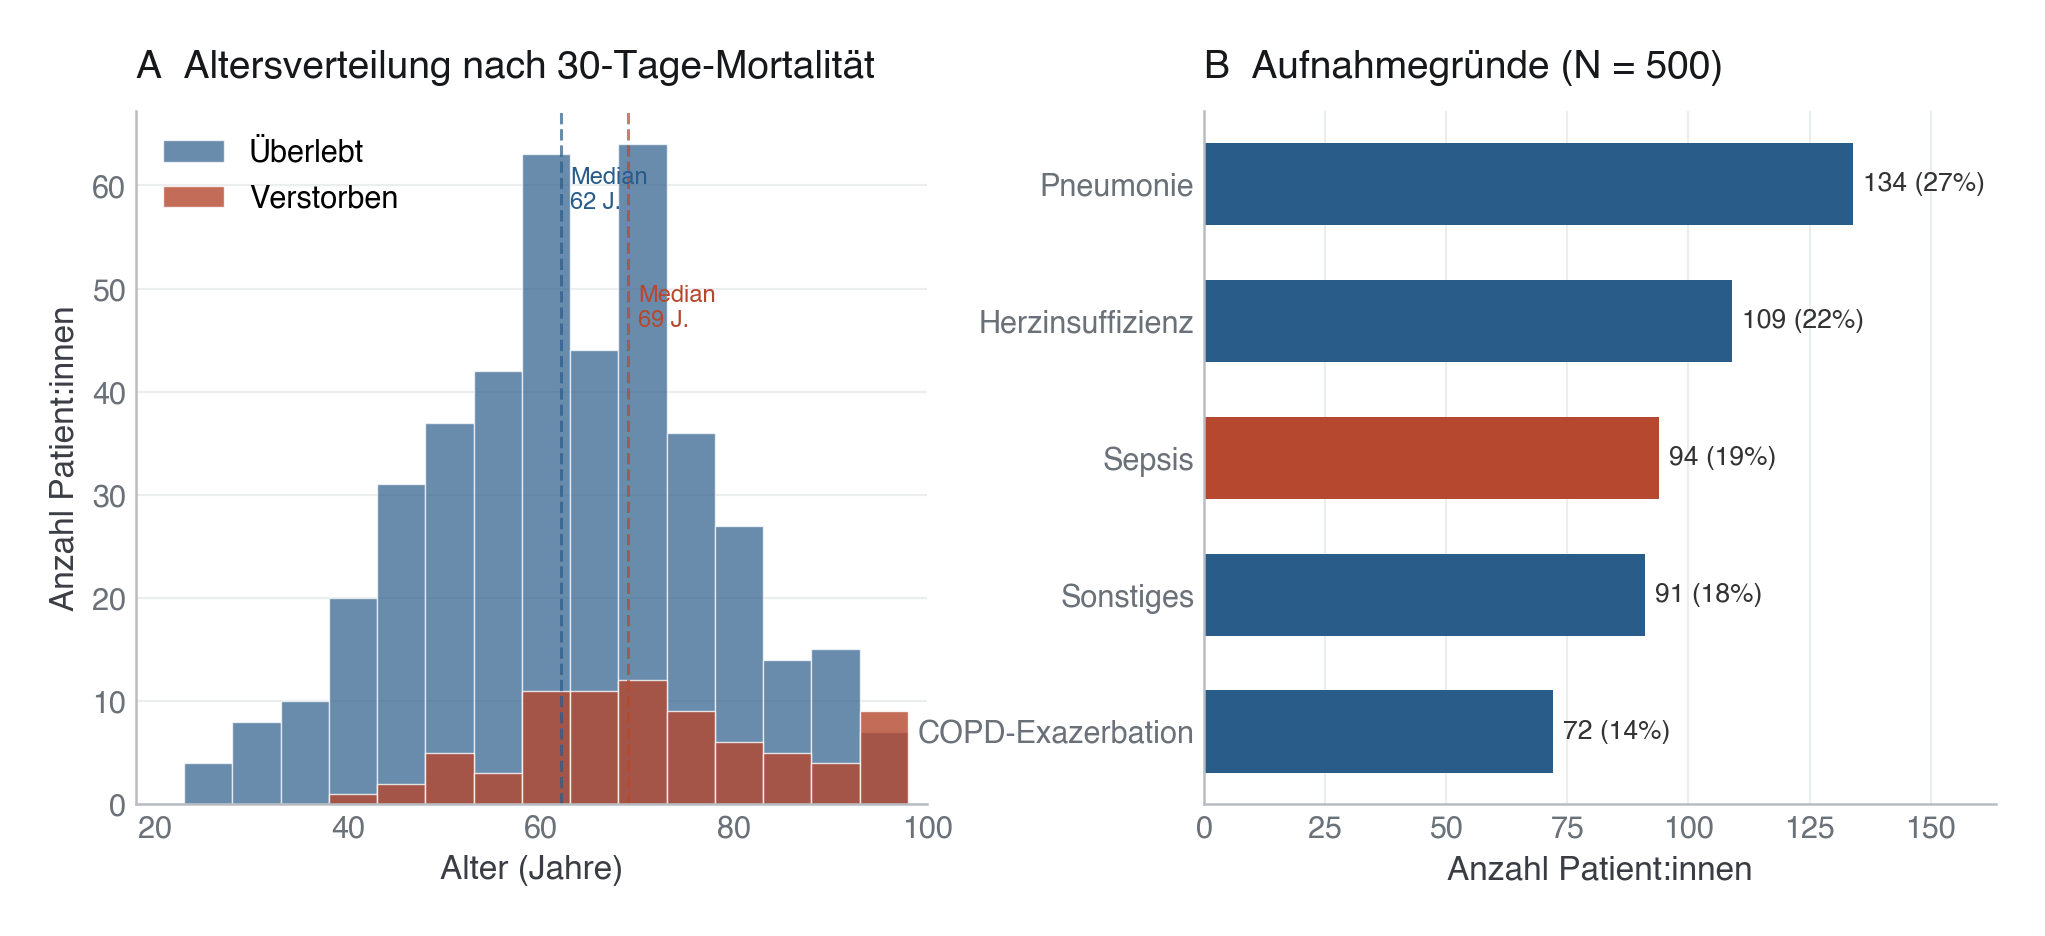
Erzeugt im Abschnitt „MODULE 01 · Cohort overview" in data/figures.py, Zeile 60–108.
Dieses Skript läuft von oben nach unten. Der gemeinsame Vorspann — Bibliotheken, Kohorte laden, Plot-Stil — steht am Anfang der vollständigen Datei und gilt für alle Abbildungen darin.
Python
Python-Code: in eine Datei mit Endung
.py schreiben und mit dem ▶-Knopf in VS Code ausführen – oder Zeile für Zeile in die Python-Konsole. Setzt die in Modul 02 eingerichtete Umgebung voraus.# =========================================================================== # MODULE 01 · Cohort overview # =========================================================================== print("\n[01] Kohortenueberblick ...") fig, axes = plt.subplots(1, 2, figsize=(12, 4.5)) fig.subplots_adjust(wspace=0.35) # Panel A: age histogram ax = axes[0] survived = cohort.loc[cohort["verstorben_30d"] == 0, "alter"] deceased = cohort.loc[cohort["verstorben_30d"] == 1, "alter"] bins = np.arange(18, 100, 5) ax.hist(survived, bins=bins, alpha=0.70, color=PRIMARY, label="Überlebt", edgecolor="white", linewidth=0.5) ax.hist(deceased, bins=bins, alpha=0.80, color=EVENT, label="Verstorben", edgecolor="white", linewidth=0.5) ax.set_xlabel("Alter (Jahre)") ax.set_ylabel("Anzahl Patient:innen") ax.set_title("A Altersverteilung nach 30-Tage-Mortalität") ax.legend(title=None) ax.set_xlim(18, 100) # Median lines ax.axvline(survived.median(), color=PRIMARY, linestyle="--", linewidth=1.1, alpha=0.7) ax.axvline(deceased.median(), color=EVENT, linestyle="--", linewidth=1.1, alpha=0.7) ax.text(survived.median() + 1, ax.get_ylim()[1] * 0.92, f"Median\n{survived.median():.0f} J.", fontsize=8.5, color=PRIMARY, va="top") ax.text(deceased.median() + 1, ax.get_ylim()[1] * 0.75, f"Median\n{deceased.median():.0f} J.", fontsize=8.5, color=EVENT, va="top") # Panel B: admission reasons (horizontal bars) ax2 = axes[1] counts = (cohort["aufnahmegrund"] .value_counts() .sort_values(ascending=True)) bar_colors = [EVENT if g == "Sepsis" else PRIMARY for g in counts.index] bars = ax2.barh(counts.index, counts.values, color=bar_colors, edgecolor="none", height=0.6) ax2.set_xlabel("Anzahl Patient:innen") ax2.set_title("B Aufnahmegründe (N = 500)") ax2.grid(axis="x") ax2.grid(axis="y", visible=False) # Bar labels with percentages total = counts.sum() for bar, val in zip(bars, counts.values): ax2.text(val + 2, bar.get_y() + bar.get_height() / 2, f"{val} ({val/total:.0%})", va="center", fontsize=9.5, color="#333333") ax2.set_xlim(0, counts.max() * 1.22) save(fig, ASSETS / "01-einfuehrung" / "assets" / "kohorte_ueberblick.png")