02 · Entwicklungsumgebung und Werkzeuge
workspace_setup.svg
Abbildung · Quellcode
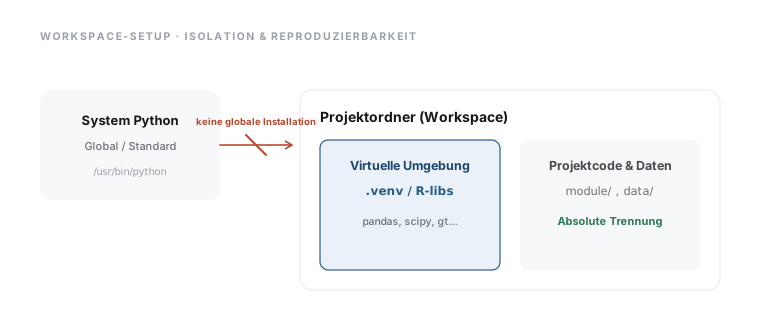
Erzeugt von workspace_setup() in lib/diagrams.py, Zeile 381–413.
Python
Python-Code: in eine Datei mit Endung
.py schreiben und mit dem ▶-Knopf in VS Code ausführen – oder Zeile für Zeile in die Python-Konsole. Setzt die in Modul 02 eingerichtete Umgebung voraus.def workspace_setup() -> str: b = [eyebrow(40, 40, "Workspace-Setup · Isolation & Reproduzierbarkeit")] # System Python (Left) b.append(rect(40, 90, 180, 110, r=12, fill=T["soft"])) b.append(txt(130, 125, "System Python", size=13, fill=T["ink"], w=600, anchor="middle")) b.append(txt(130, 150, "Global / Standard", size=11, fill=T["mut"], anchor="middle")) b.append(txt(130, 175, "/usr/bin/python", size=10, fill=T["faint"], anchor="middle", mono=True)) # Project Workspace (Right) b.append(rect(300, 90, 420, 200, r=12, fill=T["card"], stroke=T["rule"])) b.append(txt(320, 122, "Projektordner (Workspace)", size=14, fill=T["ink"], w=700)) # Inside Workspace: .venv b.append(rect(320, 140, 180, 130, r=8, fill=T["acct"], stroke=T["acc"], sw=1.2)) b.append(txt(410, 170, "Virtuelle Umgebung", size=12.5, fill=T["acc2"], w=600, anchor="middle")) b.append(txt(410, 195, ".venv / R-libs", size=12, fill=T["acc"], w=700, anchor="middle", mono=True)) b.append(txt(410, 225, "pandas, scipy, gt...", size=10.5, fill=T["mut"], anchor="middle")) # Inside Workspace: Code/Data b.append(rect(520, 140, 180, 130, r=8, fill=T["soft"])) b.append(txt(610, 170, "Projektcode & Daten", size=12.5, fill=T["ink2"], w=600, anchor="middle")) b.append(txt(610, 195, "module/ , data/", size=11.5, fill=T["mut"], anchor="middle", mono=True)) b.append(txt(610, 225, "Absolute Trennung", size=11, fill=T["ok"], w=600, anchor="middle")) # Arrow between System Python and .venv: Crossed out! b.append(line(220, 145, 292, 145, stroke=T["death"], sw=1.6)) b.append(f'<path d="M292,145 l-7,-4 M292,145 l-7,4" stroke="{T["death"]}" stroke-width="1.6" fill="none"/>') # Cross out symbol b.append(line(246, 135, 266, 155, stroke=T["death"], sw=2)) b.append(txt(256, 125, "keine globale Installation", size=9.5, fill=T["death"], w=600, anchor="middle")) return canvas(760, 320, "".join(b), "Workspace Setup isolation diagram")