03 · Programmiergrundlagen in Python und R
dataframe_anatomie.svg
Abbildung · Quellcode
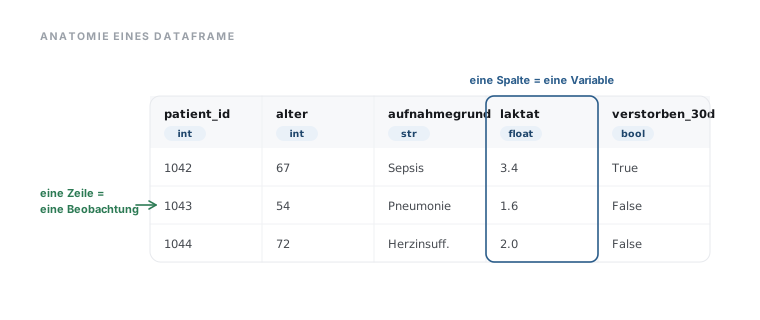
Erzeugt von dataframe_anatomie() in lib/diagrams.py, Zeile 191–228.
Python
Python-Code: in eine Datei mit Endung
.py schreiben und mit dem ▶-Knopf in VS Code ausführen – oder Zeile für Zeile in die Python-Konsole. Setzt die in Modul 02 eingerichtete Umgebung voraus.def dataframe_anatomie() -> str: cols = [("patient_id", "int", "1042"), ("alter", "int", "67"), ("aufnahmegrund", "str", "Sepsis"), ("laktat", "float", "3.4"), ("verstorben_30d", "bool", "True")] rows = [["1042", "67", "Sepsis", "3.4", "True"], ["1043", "54", "Pneumonie", "1.6", "False"], ["1044", "72", "Herzinsuff.", "2.0", "False"]] x0, y0 = 150, 96 cw, hh, rh = 112, 52, 38 tw = cw * len(cols) b = [eyebrow(40, 40, "Anatomie eines DataFrame")] # Kopf mit dtype-Pillen b.append(rect(x0, y0, tw, hh, r=0, fill=T["soft"])) for j, (name, dt, _) in enumerate(cols): cx = x0 + j * cw b.append(txt(cx + 14, y0 + 22, name, size=11.5, fill=T["ink"], w=600, mono=True)) b.append(pill(cx + 14, y0 + 30, 42, 15, dt, T["acct"], T["acc2"], size=9.5, mono=True)) if j: b.append(line(cx, y0, cx, y0 + hh + rh * len(rows), stroke=T["hair"])) # Datenzeilen for i, r in enumerate(rows): ry = y0 + hh + i * rh if i: b.append(line(x0, ry, x0 + tw, ry, stroke=T["hair"])) for j, v in enumerate(r): b.append(txt(x0 + j * cw + 14, ry + 24, v, size=11.5, fill=T["ink2"], mono=True)) # Rahmen b.append(rect(x0, y0, tw, hh + rh * len(rows), r=10, fill="none", stroke=T["rule"])) # Spalten-Hervorhebung (eine Variable) hx = x0 + 3 * cw b.append(rect(hx, y0, cw, hh + rh * len(rows), r=8, fill="none", stroke=T["acc"], sw=1.6)) b.append(txt(hx + cw / 2, y0 - 12, "eine Spalte = eine Variable", size=11, fill=T["acc"], w=600, anchor="middle")) # Zeilen-Label (eine Beobachtung) ry = y0 + hh + rh + rh / 2 b.append(arrow(150 - 14, ry, x0 + 6, color=T["ok"])) b.append(txt(40, ry - 8, "eine Zeile =", size=11, fill=T["ok"], w=600)) b.append(txt(40, ry + 8, "eine Beobachtung", size=11, fill=T["ok"], w=600)) return canvas(760, 320, "".join(b), "Ein DataFrame ist eine Tabelle: jede Spalte ist eine Variable mit einem Datentyp " "(int, str, float, bool), jede Zeile eine Beobachtung (eine Patient:in).")