05 · Datenbank-Abfragen mit SQL
datenmodell.svg
Abbildung · Quellcode
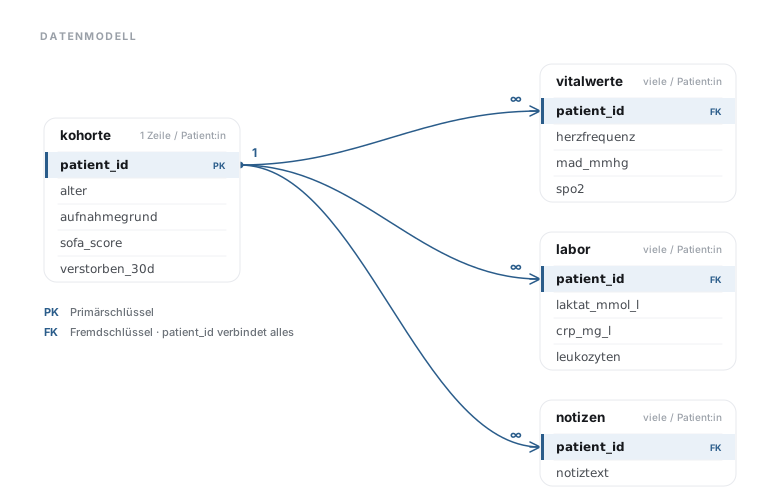
Erzeugt von datenmodell() in lib/diagrams.py, Zeile 84–141.
Python
Python-Code: in eine Datei mit Endung
.py schreiben und mit dem ▶-Knopf in VS Code ausführen – oder Zeile für Zeile in die Python-Konsole. Setzt die in Modul 02 eingerichtete Umgebung voraus.def datenmodell() -> str: b = [eyebrow(40, 40, "Datenmodell")] W = 196 row_h = 26 def table(x, y, name, hint, cols, keyrow=0): parts = [rect(x, y, W, 34 + row_h * len(cols), r=12, fill=T["card"], stroke=T["rule"])] parts.append(txt(x + 16, y + 22, name, size=13.5, fill=T["ink"], w=600)) parts.append(txt(x + W - 14, y + 21, hint, size=10, fill=T["faint"], anchor="end")) parts.append(line(x + 14, y + 34, x + W - 14, y + 34, stroke=T["hair"])) for i, (col, tag) in enumerate(cols): cy = y + 34 + row_h * i key = i == keyrow if key: parts.append(rect(x + 1, cy, W - 2, row_h, r=0, fill=T["acct"])) parts.append(rect(x + 1, cy, 3, row_h, r=0, fill=T["acc"])) parts.append(txt(x + 16, cy + 17, col, size=12, fill=T["ink"] if key else T["ink2"], w=600 if key else None, mono=True)) if tag: parts.append(txt(x + W - 14, cy + 17, tag, size=9, fill=T["acc"], w=700, anchor="end")) if i < len(cols) - 1: parts.append(line(x + 14, cy + row_h, x + W - 14, cy + row_h, stroke=T["hair"])) return "".join(parts), 34 + row_h * len(cols) kx, ky = 44, 118 ktbl, kh = table(kx, ky, "kohorte", "1 Zeile / Patient:in", [("patient_id", "PK"), ("alter", ""), ("aufnahmegrund", ""), ("sofa_score", ""), ("verstorben_30d", "")]) rx = 540 specs = [(64, "vitalwerte", [("patient_id", "FK"), ("herzfrequenz", ""), ("mad_mmhg", ""), ("spo2", "")]), (232, "labor", [("patient_id", "FK"), ("laktat_mmol_l", ""), ("crp_mg_l", ""), ("leukozyten", "")]), (400, "notizen", [("patient_id", "FK"), ("notiztext", "")])] right = [] key_y = ky + 34 + row_h / 2 # patient_id-Zeilenmitte kohorte for (yy, nm, cols) in specs: tbl, _ = table(rx, yy, nm, "viele / Patient:in", cols) right.append(tbl) ty = yy + 34 + row_h / 2 # patient_id-Zeilenmitte rechts b.append(f'<path d="M{kx+W},{key_y} C{kx+W+120},{key_y} {rx-120},{ty} {rx},{ty}" ' f'stroke="{T["acc"]}" stroke-width="1.5" fill="none"/>') b.append(f'<path d="M{rx},{ty} l-10,-5 M{rx},{ty} l-10,0 M{rx},{ty} l-10,5" ' f'stroke="{T["acc"]}" stroke-width="1.5" fill="none" stroke-linecap="round"/>') b.append(txt(rx - 18, ty - 8, "∞", size=12, fill=T["acc"], w=700, anchor="end")) b.append(f'<circle cx="{kx+W}" cy="{key_y}" r="3.4" fill="{T["acc"]}"/>') b.append(txt(kx + W + 12, key_y - 8, "1", size=12, fill=T["acc"], w=700)) b.append(ktbl) b.extend(right) # Legende ly = ky + kh + 34 b.append(txt(kx, ly, "PK", size=11, fill=T["acc"], w=700)) b.append(txt(kx + 26, ly, "Primärschlüssel", size=11, fill=T["mut"])) b.append(txt(kx, ly + 20, "FK", size=11, fill=T["acc"], w=700)) b.append(txt(kx + 26, ly + 20, "Fremdschlüssel · patient_id verbindet alles", size=11, fill=T["mut"])) return canvas(760, 500, "".join(b), "Datenmodell: kohorte hat eine Zeile pro Patient:in (Primärschlüssel patient_id); " "vitalwerte, labor und notizen verweisen über den Fremdschlüssel patient_id zurück (1 zu unendlich).")