06 · Datenbereinigung und Datentransformation
fehlende_werte.png
Abbildung · Quellcode
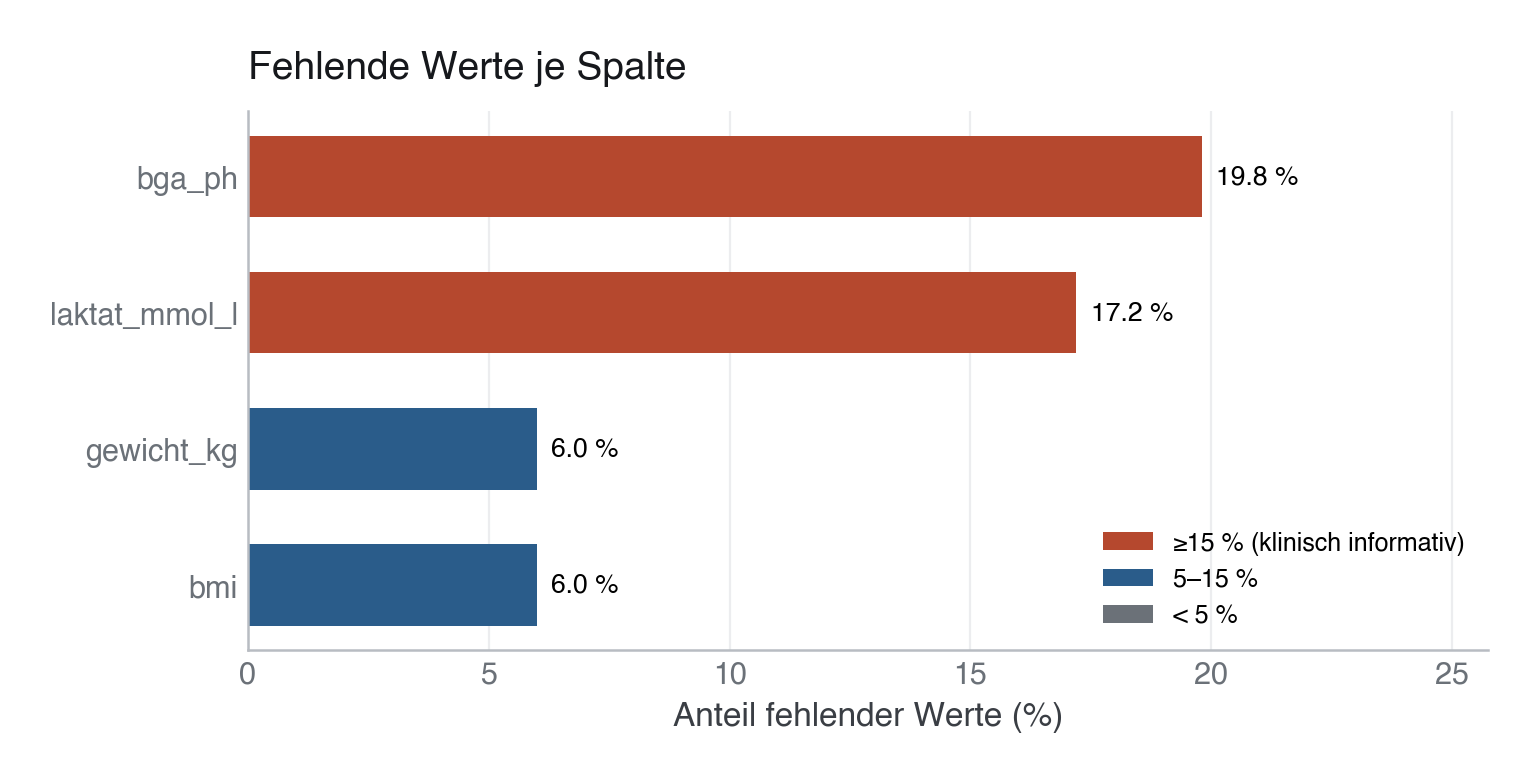
Erzeugt im Abschnitt „MODULE 06 · Missing values" in data/figures.py, Zeile 110–145.
Dieses Skript läuft von oben nach unten. Der gemeinsame Vorspann — Bibliotheken, Kohorte laden, Plot-Stil — steht am Anfang der vollständigen Datei und gilt für alle Abbildungen darin.
Python
Python-Code: in eine Datei mit Endung
.py schreiben und mit dem ▶-Knopf in VS Code ausführen – oder Zeile für Zeile in die Python-Konsole. Setzt die in Modul 02 eingerichtete Umgebung voraus.# =========================================================================== # MODULE 06 · Missing values # =========================================================================== print("[06] Fehlende Werte ...") # All relevant columns (cohort + labs, excluding patient_id) all_cols = df.drop(columns=["patient_id"]) missing_pct = all_cols.isna().mean().mul(100).sort_values(ascending=True) missing_pct = missing_pct[missing_pct > 0] # only columns with missing values fig, ax = plt.subplots(figsize=(8, max(3.5, len(missing_pct) * 0.55))) bar_colors = [EVENT if pct >= 15 else PRIMARY if pct >= 5 else SECONDARY for pct in missing_pct.values] bars = ax.barh(missing_pct.index, missing_pct.values, color=bar_colors, edgecolor="none", height=0.6) ax.set_xlabel("Anteil fehlender Werte (%)") ax.set_title("Fehlende Werte je Spalte") ax.grid(axis="x") ax.grid(axis="y", visible=False) ax.set_xlim(0, missing_pct.max() * 1.30) for bar, pct in zip(bars, missing_pct.values): ax.text(pct + 0.3, bar.get_y() + bar.get_height() / 2, f"{pct:.1f} %", va="center", fontsize=9.5) # Legend from matplotlib.patches import Patch legend_items = [ Patch(facecolor=EVENT, label="≥15 % (klinisch informativ)"), Patch(facecolor=PRIMARY, label="5–15 %"), Patch(facecolor=SECONDARY, label="< 5 %"), ] ax.legend(handles=legend_items, loc="lower right", fontsize=9) save(fig, ASSETS / "06-transformation" / "assets" / "fehlende_werte.png")