07 · Patientendaten-Extraktion via FHIR und OMOP
fhir_omop_flow.png
Abbildung · Quellcode
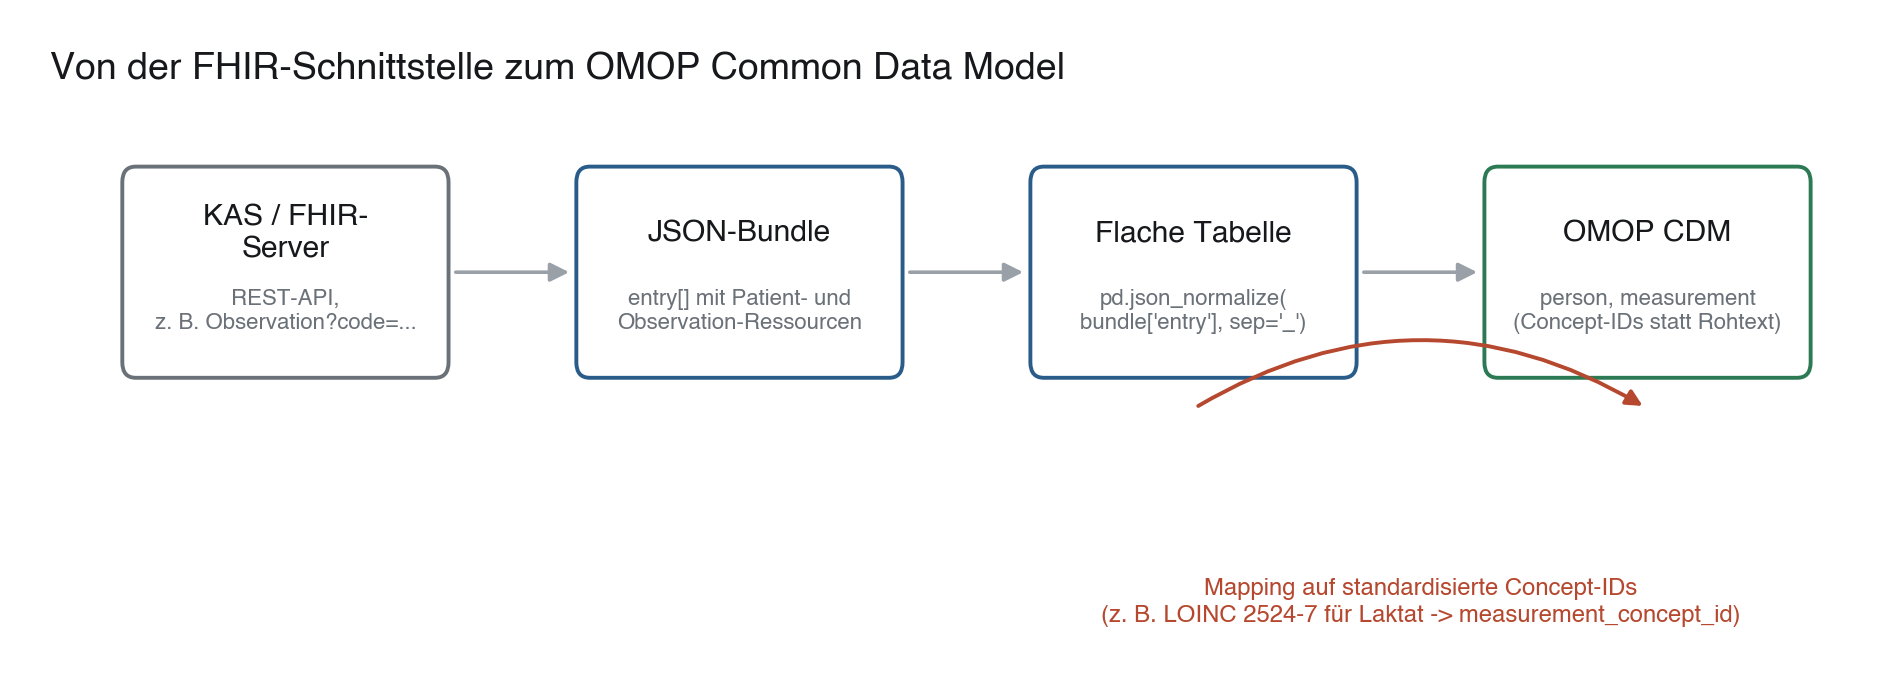
Erzeugt von fig_fhir_omop_flow() in module/07-fhir-omop-praxis/code/figures.py, Zeile 25–66.
Python
Python-Code: in eine Datei mit Endung
.py schreiben und mit dem ▶-Knopf in VS Code ausführen – oder Zeile für Zeile in die Python-Konsole. Setzt die in Modul 02 eingerichtete Umgebung voraus.def fig_fhir_omop_flow() -> None: fig, ax = plt.subplots(figsize=(11.5, 3.9)) ax.set_xlim(-0.3, 10.3) ax.set_ylim(0, 3.1) ax.axis("off") # Row 1: FHIR REST -> JSON Bundle -> flache Tabelle boxes_top = [ (1.1, "KAS / FHIR-\nServer", "REST-API,\nz. B. Observation?code=...", "#6B7178"), (3.8, "JSON-Bundle", "entry[] mit Patient- und\nObservation-Ressourcen", PRIMARY), (6.5, "Flache Tabelle", "pd.json_normalize(\nbundle['entry'], sep='_')", PRIMARY), (9.2, "OMOP CDM", "person, measurement\n(Concept-IDs statt Rohtext)", "#2C7A54"), ] y_top = 1.95 box_w, box_h = 1.9, 1.05 for x_c, title, sub, color in boxes_top: box = FancyBboxPatch((x_c - box_w / 2, y_top - box_h / 2), box_w, box_h, boxstyle="round,pad=0.02,rounding_size=0.08", linewidth=1.4, edgecolor=color, facecolor="white", zorder=3) ax.add_patch(box) ax.text(x_c, y_top + 0.2, title, ha="center", va="center", fontsize=10.8, fontweight="bold", color="#16181C", zorder=4) ax.text(x_c, y_top - 0.2, sub, ha="center", va="center", fontsize=8.0, color="#6B7178", zorder=4) for (x1, *_), (x2, *_) in zip(boxes_top, boxes_top[1:]): arrow = FancyArrowPatch((x1 + box_w / 2 + 0.03, y_top), (x2 - box_w / 2 - 0.03, y_top), arrowstyle="-|>", mutation_scale=14, linewidth=1.3, color="#9AA0A8", zorder=2) ax.add_patch(arrow) # Der entscheidende Schritt zwischen Tabelle und OMOP. ax.annotate("", xy=(9.2, y_top - box_h / 2 - 0.18), xytext=(6.5, y_top - box_h / 2 - 0.18), arrowprops=dict(arrowstyle="-|>", color=EVENT, lw=1.4, connectionstyle="arc3,rad=-0.3")) ax.text(7.85, 0.25, "Mapping auf standardisierte Concept-IDs\n(z. B. LOINC 2524-7 für Laktat -> measurement_concept_id)", ha="center", va="center", fontsize=8.6, color=EVENT) ax.text(-0.3, 2.95, "Von der FHIR-Schnittstelle zum OMOP Common Data Model", fontsize=13.5, fontweight="bold", color="#16181C", ha="left") save(fig, ASSETS / "fhir_omop_flow.png")