09 · Deskriptive Statistik und die Table 1
baseline_nach_outcome.png
Abbildung · Quellcode
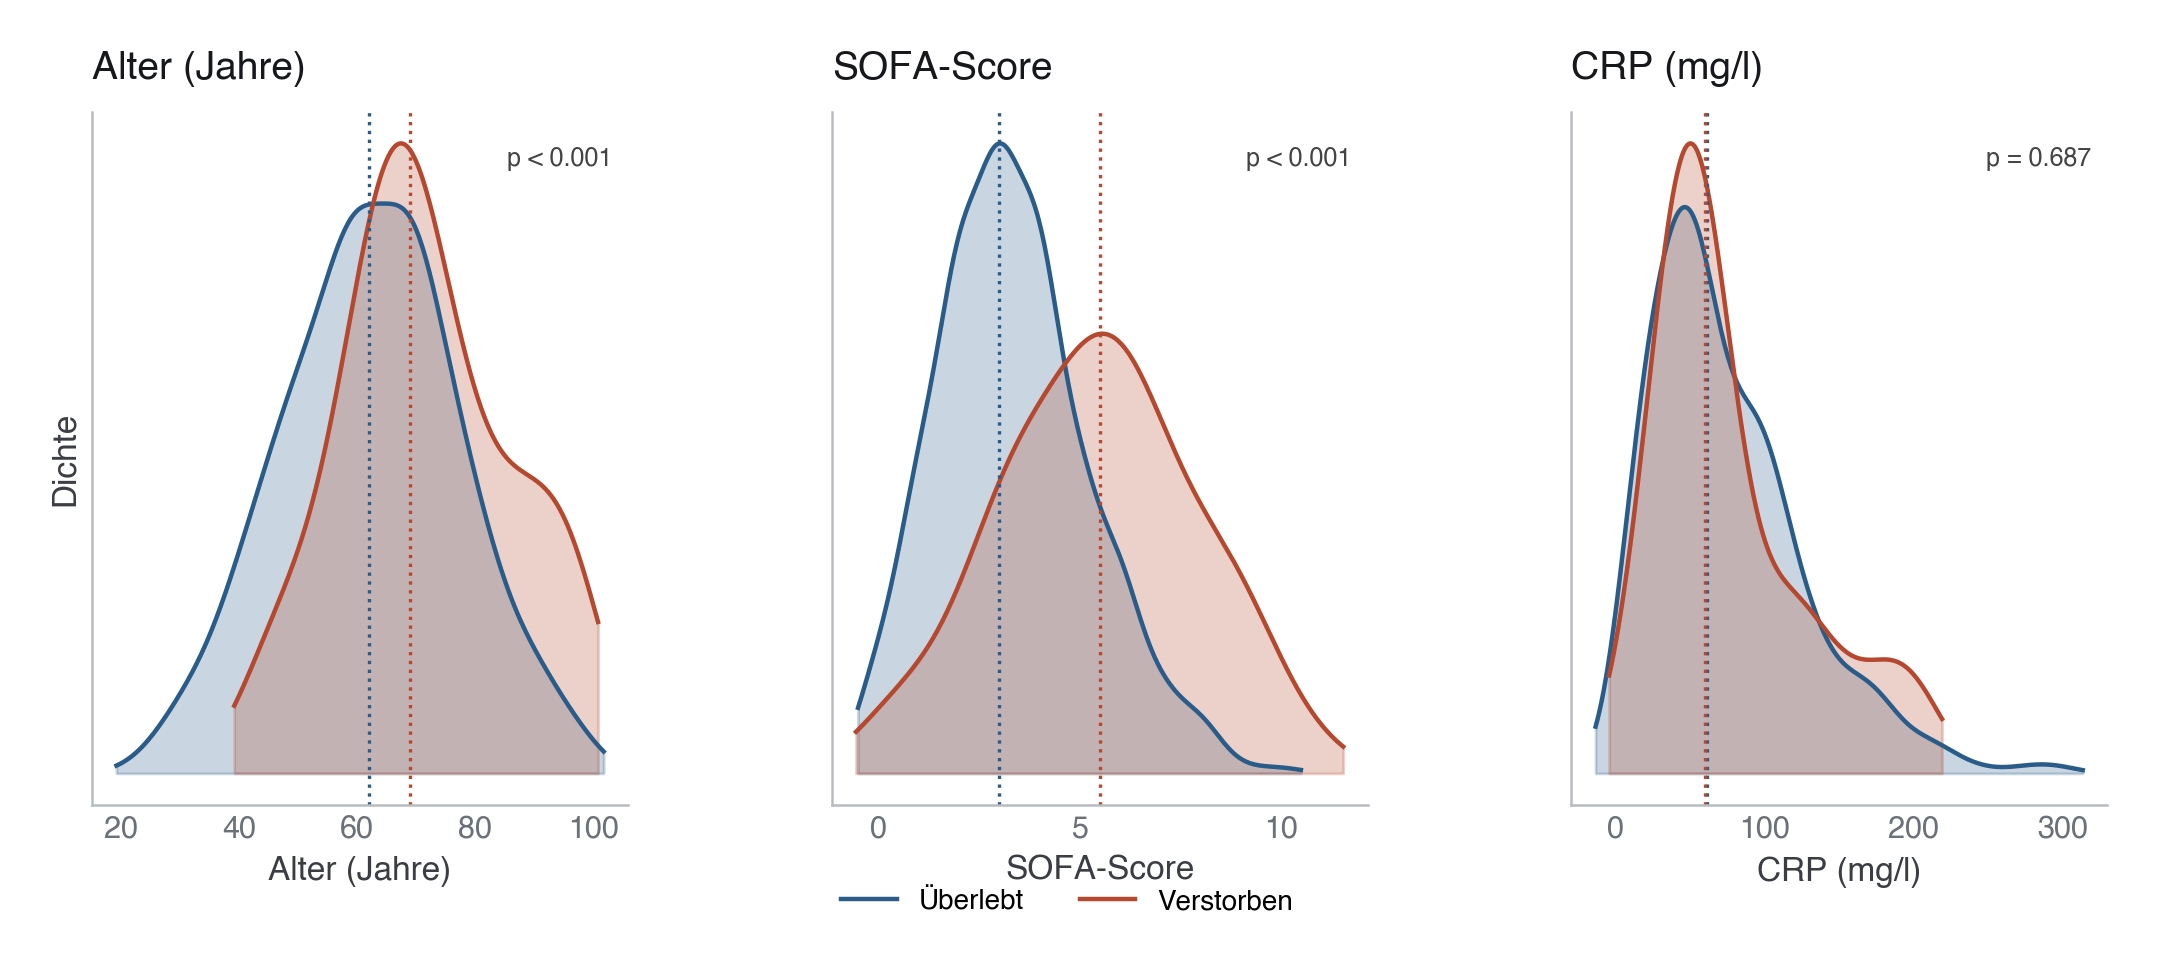
Erzeugt im Abschnitt „MODULE 09 · Baseline by outcome" in data/figures.py, Zeile 231–284.
Dieses Skript läuft von oben nach unten. Der gemeinsame Vorspann — Bibliotheken, Kohorte laden, Plot-Stil — steht am Anfang der vollständigen Datei und gilt für alle Abbildungen darin.
Python
Python-Code: in eine Datei mit Endung
.py schreiben und mit dem ▶-Knopf in VS Code ausführen – oder Zeile für Zeile in die Python-Konsole. Setzt die in Modul 02 eingerichtete Umgebung voraus.# =========================================================================== # MODULE 09 · Baseline by outcome # =========================================================================== print("[09] Baseline nach Outcome ...") variables = [ ("alter", "Alter (Jahre)"), ("sofa_score", "SOFA-Score"), ("crp_mg_l", "CRP (mg/l)"), ] fig, axes = plt.subplots(1, 3, figsize=(13, 4.5)) fig.subplots_adjust(wspace=0.38) for ax, (var, label) in zip(axes, variables): group0 = cohort.loc[cohort["verstorben_30d"] == 0, var].dropna() group1 = cohort.loc[cohort["verstorben_30d"] == 1, var].dropna() # KDE curves from scipy.stats import gaussian_kde for group, color, grp_label in [ (group0, PRIMARY, "Überlebt"), (group1, EVENT, "Verstorben"), ]: kde = gaussian_kde(group, bw_method="scott") xmin, xmax = group.min(), group.max() x_range = np.linspace(xmin - (xmax - xmin) * 0.05, xmax + (xmax - xmin) * 0.05, 300) density = kde(x_range) ax.fill_between(x_range, density, alpha=0.25, color=color) ax.plot(x_range, density, color=color, linewidth=1.6, label=grp_label) # Median lines ax.axvline(group0.median(), color=PRIMARY, linestyle=":", linewidth=1.2) ax.axvline(group1.median(), color=EVENT, linestyle=":", linewidth=1.2) ax.set_xlabel(label) ax.set_ylabel("Dichte" if ax == axes[0] else "") ax.set_title(label) ax.set_yticks([]) ax.grid(axis="x", visible=False) # Mann-Whitney p-value _, p = stats.mannwhitneyu(group0, group1, alternative="two-sided") p_txt = f"p = {p:.3f}" if p >= 0.001 else "p < 0.001" ax.text(0.97, 0.95, p_txt, transform=ax.transAxes, ha="right", va="top", fontsize=9, color="#444444") # Shared legend handles, labels = axes[0].get_legend_handles_labels() fig.legend(handles, labels, loc="lower center", ncol=2, bbox_to_anchor=(0.5, -0.04), fontsize=10) save(fig, ASSETS / "09-deskriptive-statistik" / "assets" / "baseline_nach_outcome.png")