09 · Deskriptive Statistik und die Table 1
spc_run_chart.png
Abbildung · Quellcode
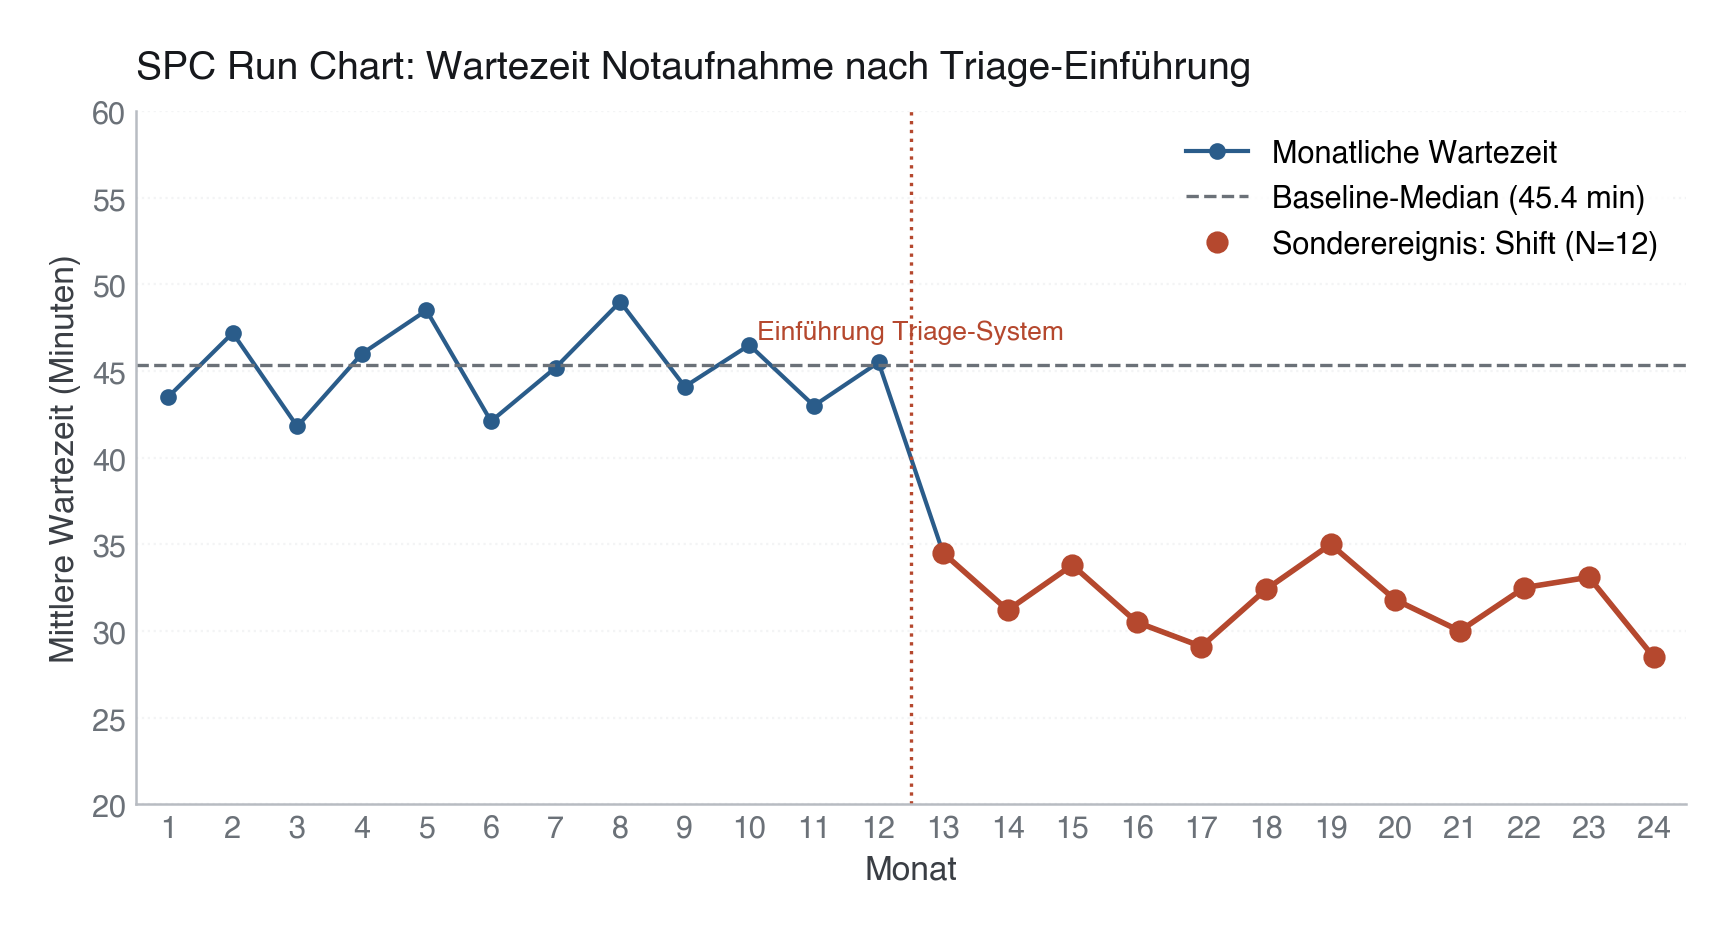
Erzeugt im Abschnitt „MODULE 09 · SPC Run Chart" in data/figures.py, Zeile 286–329.
Dieses Skript läuft von oben nach unten. Der gemeinsame Vorspann — Bibliotheken, Kohorte laden, Plot-Stil — steht am Anfang der vollständigen Datei und gilt für alle Abbildungen darin.
Python
Python-Code: in eine Datei mit Endung
.py schreiben und mit dem ▶-Knopf in VS Code ausführen – oder Zeile für Zeile in die Python-Konsole. Setzt die in Modul 02 eingerichtete Umgebung voraus.# =========================================================================== # MODULE 09 · SPC Run Chart # =========================================================================== print("[09] SPC Run Chart ...") months = np.arange(1, 25) # Wait times: first 12 months around 45 min, next 12 months around 32 min wait_times = [ 43.5, 47.2, 41.8, 46.0, 48.5, 42.1, 45.2, 49.0, 44.1, 46.5, 43.0, 45.5, # Baseline (median 45.35) 34.5, 31.2, 33.8, 30.5, 29.1, 32.4, 35.0, 31.8, 30.0, 32.5, 33.1, 28.5 # Shift (all below baseline median) ] fig, ax = plt.subplots(figsize=(10, 4.5)) # Plot all points and lines in primary color ax.plot(months, wait_times, "o-", color=PRIMARY, linewidth=1.5, markersize=5, label="Monatliche Wartezeit") # Baseline median (first 12 months median) baseline_median = np.median(wait_times[:12]) ax.axhline(baseline_median, color="#6B7178", linestyle="--", linewidth=1.2, label=f"Baseline-Median ({baseline_median:.1f} min)") # Highlight the shift (months 13 to 24 are all below baseline median) shift_months = months[12:] shift_times = wait_times[12:] ax.plot(shift_months, shift_times, "o", color=EVENT, markersize=7, label="Sonderereignis: Shift (N=12)") ax.plot(shift_months, shift_times, "-", color=EVENT, linewidth=2.0) # Labels & styling ax.set_xlabel("Monat") ax.set_ylabel("Mittlere Wartezeit (Minuten)") ax.set_title("SPC Run Chart: Wartezeit Notaufnahme nach Triage-Einführung") ax.set_xticks(months) ax.set_xlim(0.5, 24.5) ax.set_ylim(20, 60) ax.grid(axis="y", linestyle=":", alpha=0.6) # Annotations ax.text(12.5, baseline_median + 1.5, "Einführung Triage-System", color=EVENT, fontsize=9.5, fontweight="semibold", ha="center") ax.axvline(12.5, color=EVENT, linestyle=":", linewidth=1.2) # Legend ax.legend(loc="upper right", frameon=True, facecolor="white", edgecolor="none") save(fig, ASSETS / "09-deskriptive-statistik" / "assets" / "spc_run_chart.png")