14 · Fehlende Werte und Imputation
mnar_tipping_point.png
Abbildung · Quellcode
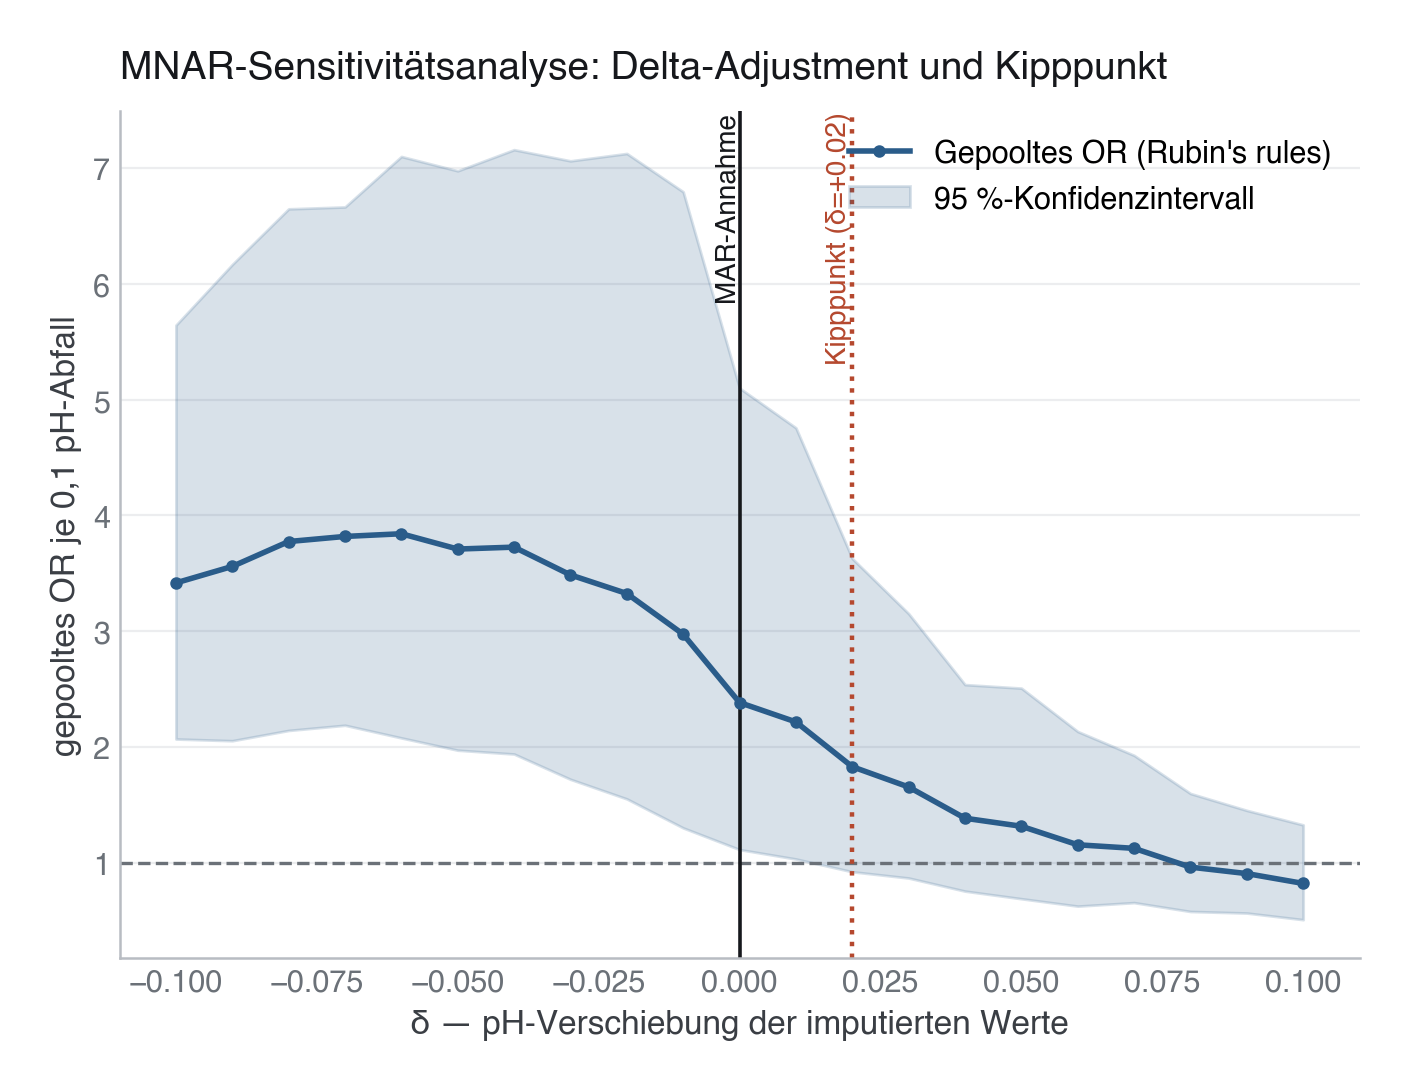
Erzeugt von make_figure() in module/14-fehlende-werte/code/mnar_delta.py, Zeile 444–477.
Python
Python-Code: in eine Datei mit Endung
.py schreiben und mit dem ▶-Knopf in VS Code ausführen – oder Zeile für Zeile in die Python-Konsole. Setzt die in Modul 02 eingerichtete Umgebung voraus.def make_figure(df: pd.DataFrame, tipping: dict) -> None: apply_style() fig, ax = plt.subplots(figsize=(8, 5.5)) df = df.sort_values("delta") ax.plot(df["delta"], df["OR"], color=PRIMARY, linewidth=2.0, marker="o", markersize=3.5, label="Gepooltes OR (Rubin's rules)") ax.fill_between(df["delta"], df["ci_lo"], df["ci_hi"], color=PRIMARY, alpha=0.18, label="95 %-Konfidenzintervall") ax.axhline(1.0, color=SECONDARY, linestyle="--", linewidth=1.2, zorder=1) ax.axvline(0.0, color="#16181C", linestyle="-", linewidth=1.3, zorder=1) ymax = ax.get_ylim()[1] ax.text(0.0, ymax, "MAR-Annahme", rotation=90, va="top", ha="right", fontsize=10, color="#16181C") # Der Kipppunkt ist das ERSTE δ, dessen KI die 1 einschließt — nicht das # letzte, bei dem sie es noch nicht tut (`boundary_delta`). Dort steht die # Schlussfolgerung noch, sie fällt einen Schritt später. literal = tipping.get("literal_tipping") if literal is not None: kipp = float(literal["delta"]) if df["delta"].min() <= kipp <= df["delta"].max(): ax.axvline(kipp, color=EVENT, linestyle=":", linewidth=1.6, zorder=1) ax.text(kipp, ymax, f"Kipppunkt (δ={kipp:+.2f})", rotation=90, va="top", ha="right", fontsize=10, color=EVENT) ax.set_xlabel("δ — pH-Verschiebung der imputierten Werte") ax.set_ylabel("gepooltes OR je 0,1 pH-Abfall") ax.set_title("MNAR-Sensitivitätsanalyse: Delta-Adjustment und Kipppunkt") ax.legend(loc="upper right") save(fig, FIGURE_PATH)