14 · Fehlende Werte und Imputation
passive_imputation.png
Abbildung · Quellcode
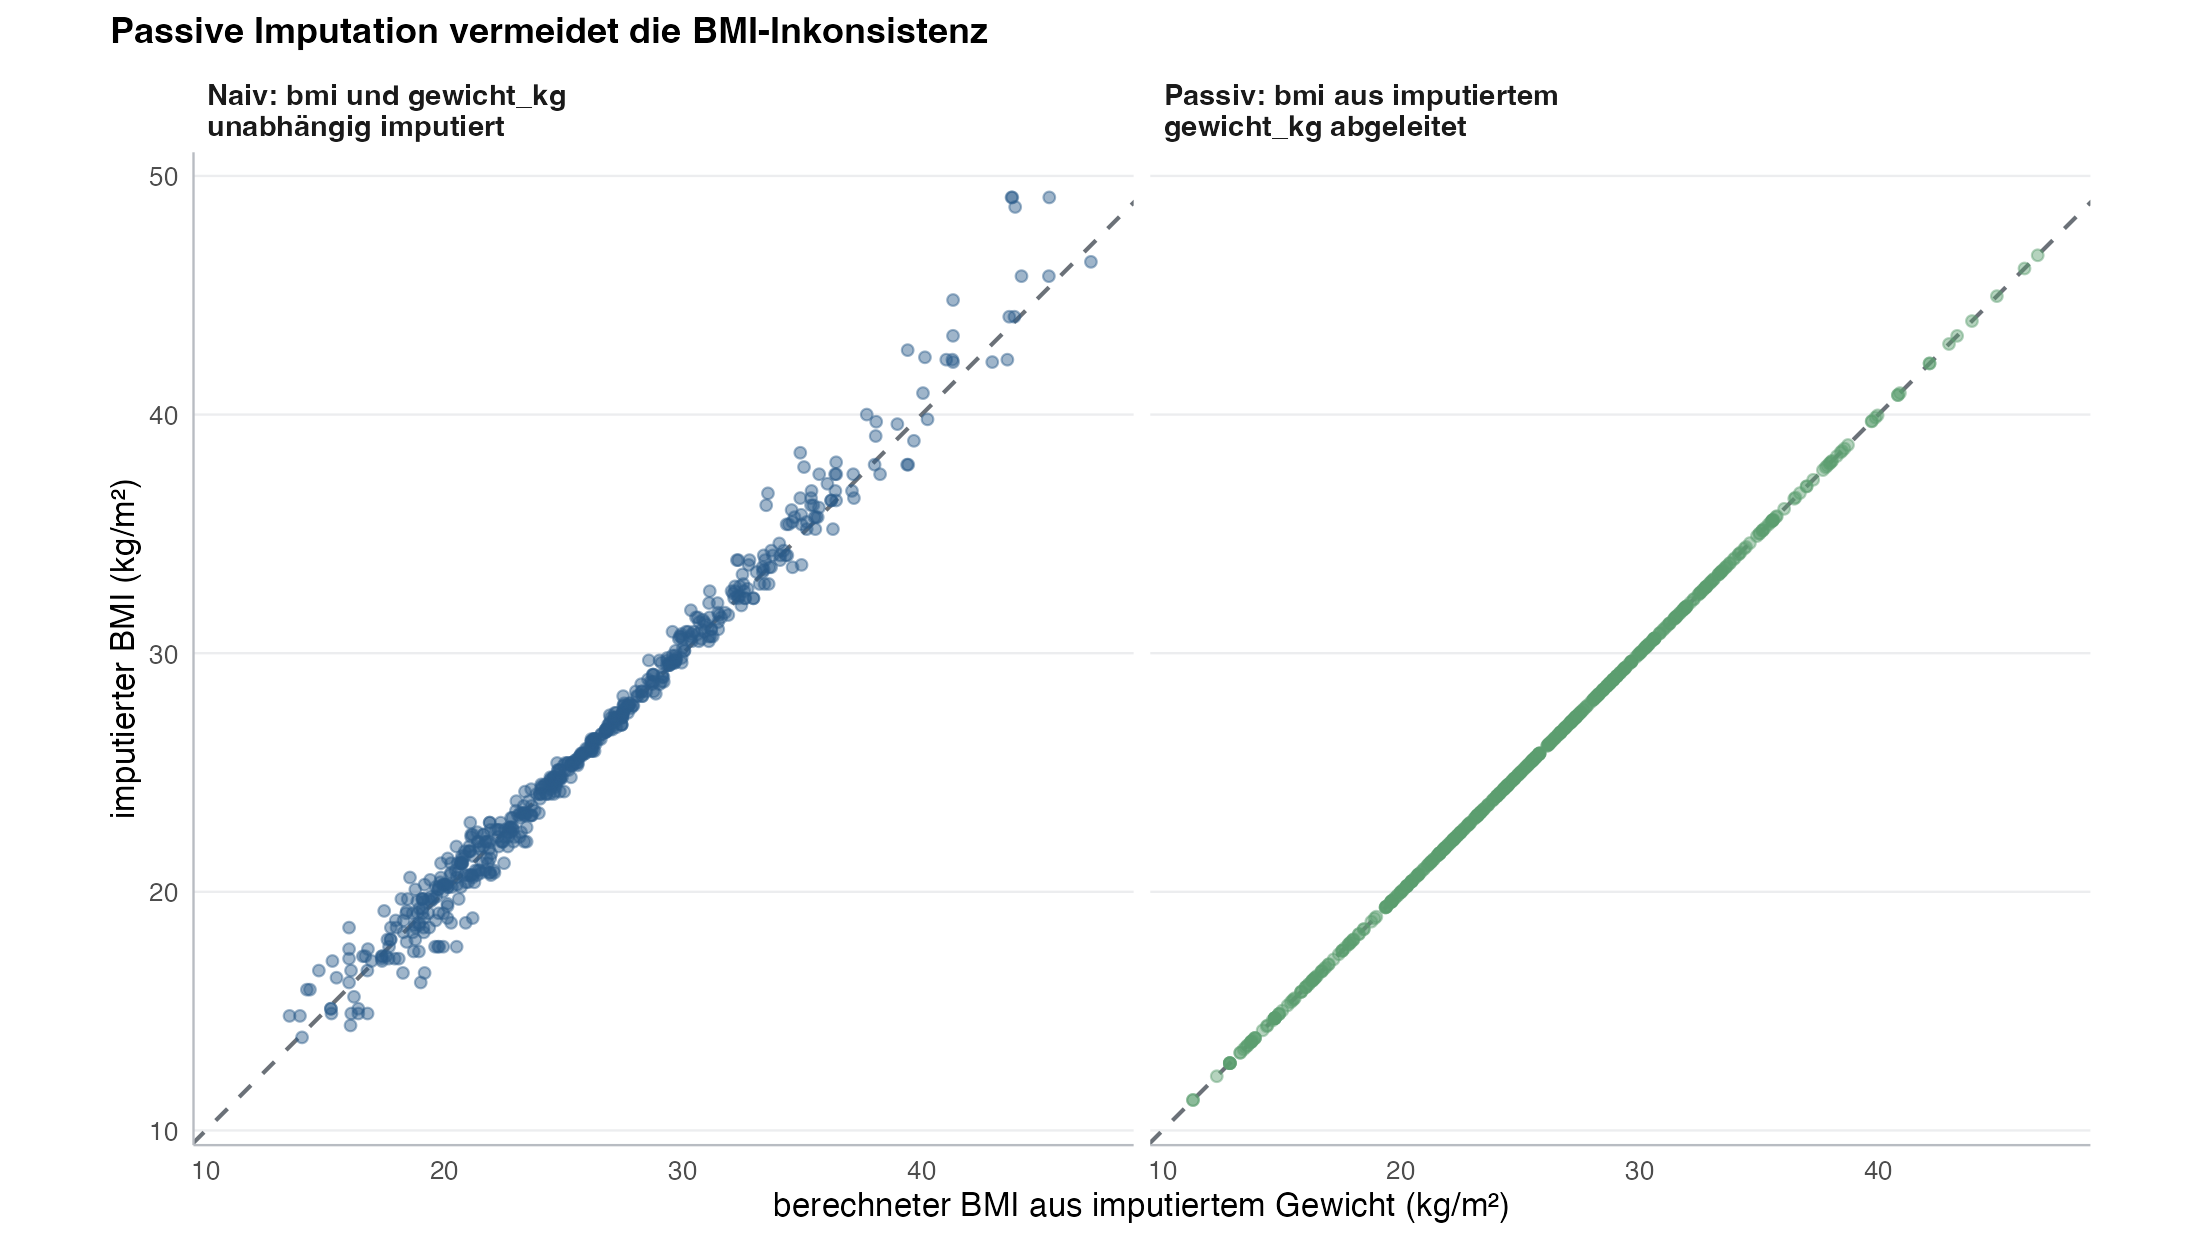
Erzeugt von _figure_passive() in module/14-fehlende-werte/code/mice_praxis.py, Zeile 150–182.
Python
Python-Code: in eine Datei mit Endung
.py schreiben und mit dem ▶-Knopf in VS Code ausführen – oder Zeile für Zeile in die Python-Konsole. Setzt die in Modul 02 eingerichtete Umgebung voraus.def _figure_passive(naive_pairs: pd.DataFrame, passive_pairs: pd.DataFrame) -> None: apply_style() fig, axes = plt.subplots(1, 2, figsize=(11, 6.2), sharex=True, sharey=True) all_vals = pd.concat([ naive_pairs[["bmi", "bmi_von_gewicht"]], passive_pairs[["bmi", "bmi_von_gewicht"]], ]) lo, hi = float(all_vals.min().min()), float(all_vals.max().max()) pad = 0.04 * (hi - lo) lo, hi = lo - pad, hi + pad panels = [ ("Naiv: bmi und gewicht_kg\nunabhängig imputiert", naive_pairs, PRIMARY), ("Passiv: bmi aus imputiertem\ngewicht_kg abgeleitet", passive_pairs, "#5B9E6E"), ] for ax, (title, data, color) in zip(axes, panels): ax.plot([lo, hi], [lo, hi], color=SECONDARY, linestyle="--", linewidth=1.3, label="Identität", zorder=1) ax.scatter(data["bmi_von_gewicht"], data["bmi"], s=20, alpha=0.5, color=color, edgecolor="none", zorder=2) ax.set_title(title, fontsize=12) ax.set_xlabel("berechneter BMI aus imputiertem Gewicht (kg/m²)") ax.set_xlim(lo, hi) ax.set_ylim(lo, hi) ax.set_aspect("equal", adjustable="box") axes[0].set_ylabel("imputierter BMI (kg/m²)") axes[0].legend(loc="upper left", fontsize=9.5) fig.suptitle("Passive Imputation vermeidet die BMI-Inkonsistenz", fontsize=14, fontweight="bold", x=0.01, y=1.0, ha="left") fig.tight_layout(rect=(0.0, 0.0, 1.0, 0.90)) save(fig, ASSETS / "passive_imputation.png")