17 · Klassische Überlebenszeitanalyse
survival_zensierung.png
Abbildung · Quellcode
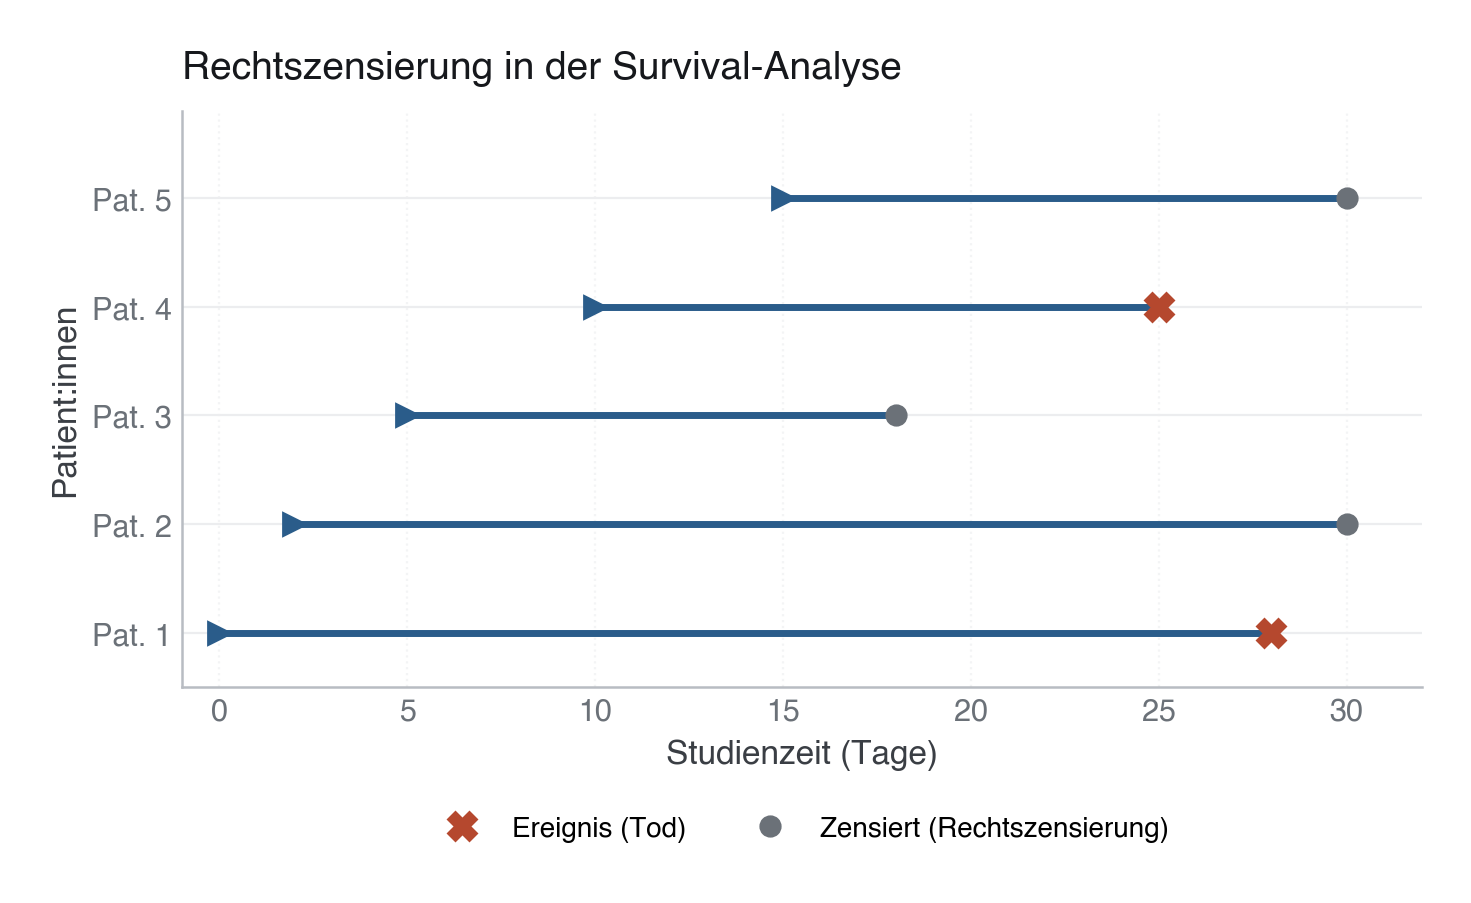
Erzeugt im Abschnitt „MODULE 17 · Classic Survival Analysis & Censoring" in data/figures.py, Zeile 713–755.
Dieses Skript läuft von oben nach unten. Der gemeinsame Vorspann — Bibliotheken, Kohorte laden, Plot-Stil — steht am Anfang der vollständigen Datei und gilt für alle Abbildungen darin.
Python
Python-Code: in eine Datei mit Endung
.py schreiben und mit dem ▶-Knopf in VS Code ausführen – oder Zeile für Zeile in die Python-Konsole. Setzt die in Modul 02 eingerichtete Umgebung voraus.# =========================================================================== # MODULE 17 · Classic Survival Analysis & Censoring # =========================================================================== print("[17] Survival-Zensierung ...") fig, ax = plt.subplots(figsize=(8, 4.5)) patients = [ {"id": "Pat. 1", "start": 0, "end": 28, "event": True, "desc": "Ereignis (Tod)"}, {"id": "Pat. 2", "start": 2, "end": 30, "event": False, "desc": "Zensiert (Studienende)"}, {"id": "Pat. 3", "start": 5, "end": 18, "event": False, "desc": "Zensiert (Loss-to-Follow-up)"}, {"id": "Pat. 4", "start": 10, "end": 25, "event": True, "desc": "Ereignis (Tod)"}, {"id": "Pat. 5", "start": 15, "end": 30, "event": False, "desc": "Zensiert (Studienende)"}, ] for idx, p in enumerate(patients): y = idx + 1 # Line for follow-up duration ax.plot([p["start"], p["end"]], [y, y], color=PRIMARY, linewidth=2.5) # Start marker ax.plot(p["start"], y, ">", color=PRIMARY, markersize=8) if p["event"]: ax.plot(p["end"], y, "X", color=EVENT, markersize=10, label="Ereignis (Tod)" if idx == 0 else "") else: ax.plot(p["end"], y, "o", color=SECONDARY, markersize=7, label="Zensiert (Rechtszensierung)" if idx == 1 else "") ax.set_yticks(range(1, len(patients) + 1)) ax.set_yticklabels([p["id"] for p in patients]) ax.set_xlabel("Studienzeit (Tage)") ax.set_ylabel("Patient:innen") ax.set_title("Rechtszensierung in der Survival-Analyse") ax.set_xlim(-1, 32) ax.set_ylim(0.5, len(patients) + 0.8) ax.grid(axis="x", linestyle=":", alpha=0.6) # Legend placed below the axes so it never overlaps the Pat. 1 row. ax.legend(loc="upper center", bbox_to_anchor=(0.5, -0.18), ncol=2, fontsize=10, frameon=False) fig.subplots_adjust(bottom=0.24) (ASSETS / "17-survival-klassisch" / "assets").mkdir(parents=True, exist_ok=True) save(fig, ASSETS / "17-survival-klassisch" / "assets" / "survival_zensierung.png")