18 · Mixed-Effects-Modelle für Longitudinaldaten
random_intercepts.png
Abbildung · Quellcode
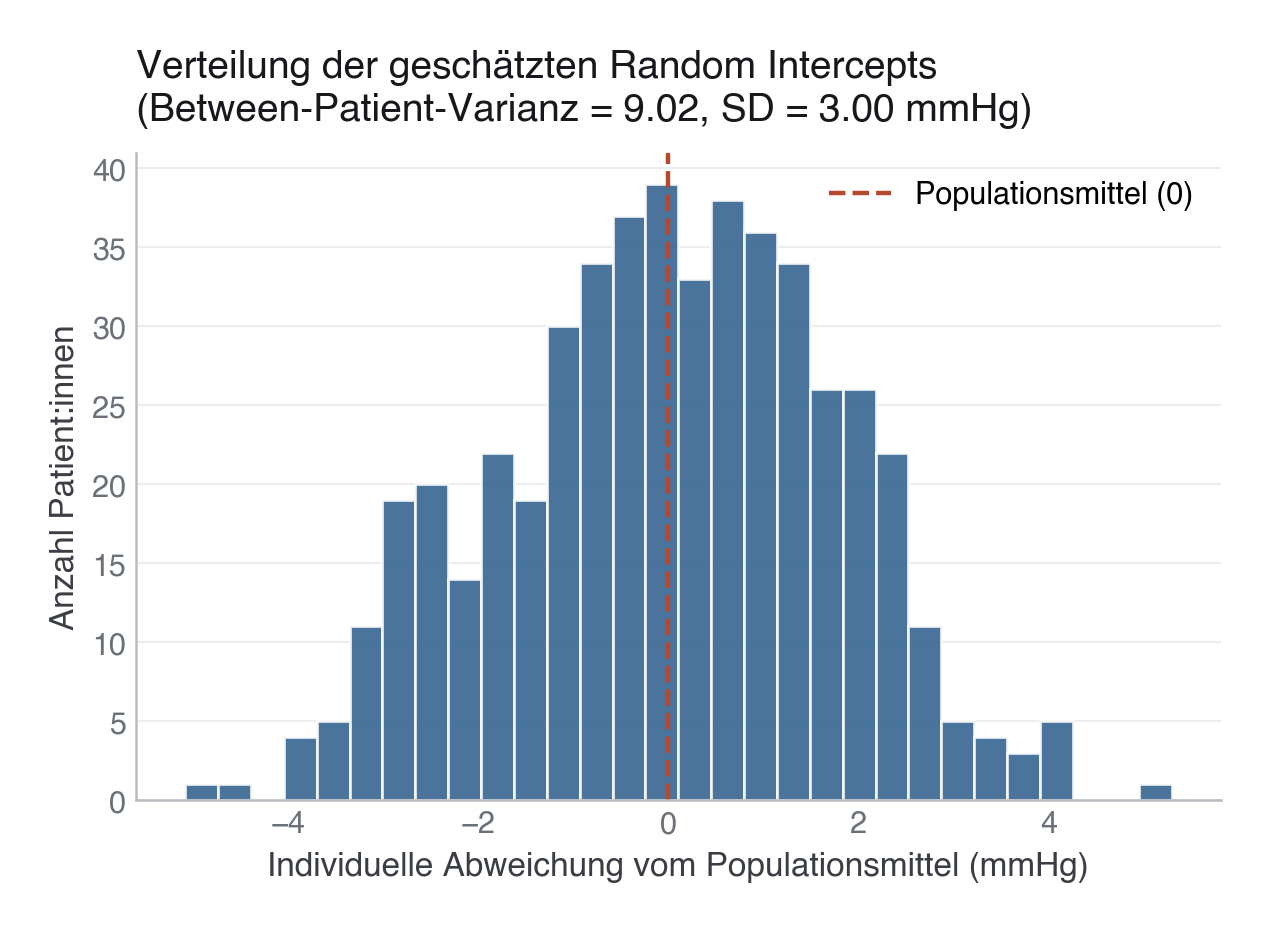
Erzeugt von fig_random_intercepts() in module/18-longitudinal-mixed-models/code/figures.py, Zeile 54–68.
Python
Python-Code: in eine Datei mit Endung
.py schreiben und mit dem ▶-Knopf in VS Code ausführen – oder Zeile für Zeile in die Python-Konsole. Setzt die in Modul 02 eingerichtete Umgebung voraus.def fig_random_intercepts(mixed) -> None: """Distribution of the estimated per-patient random intercepts (BLUPs).""" re_values = np.array([float(v.iloc[0]) for v in mixed.random_effects.values()]) group_var = float(mixed.cov_re.iloc[0, 0]) fig, ax = plt.subplots(figsize=(7, 4.2)) ax.hist(re_values, bins=30, color=PRIMARY, alpha=0.85, edgecolor="white") ax.axvline(0, color=EVENT, lw=1.6, ls="--", label="Populationsmittel (0)") ax.set_xlabel("Individuelle Abweichung vom Populationsmittel (mmHg)") ax.set_ylabel("Anzahl Patient:innen") ax.set_title("Verteilung der geschätzten Random Intercepts\n" f"(Between-Patient-Varianz = {group_var:.2f}, " f"SD = {np.sqrt(group_var):.2f} mmHg)") ax.legend(loc="upper right") save(fig, ASSETS / "random_intercepts.png")