19 · Propensity Score Matching und Weighting
ps_overlap.png
Abbildung · Quellcode
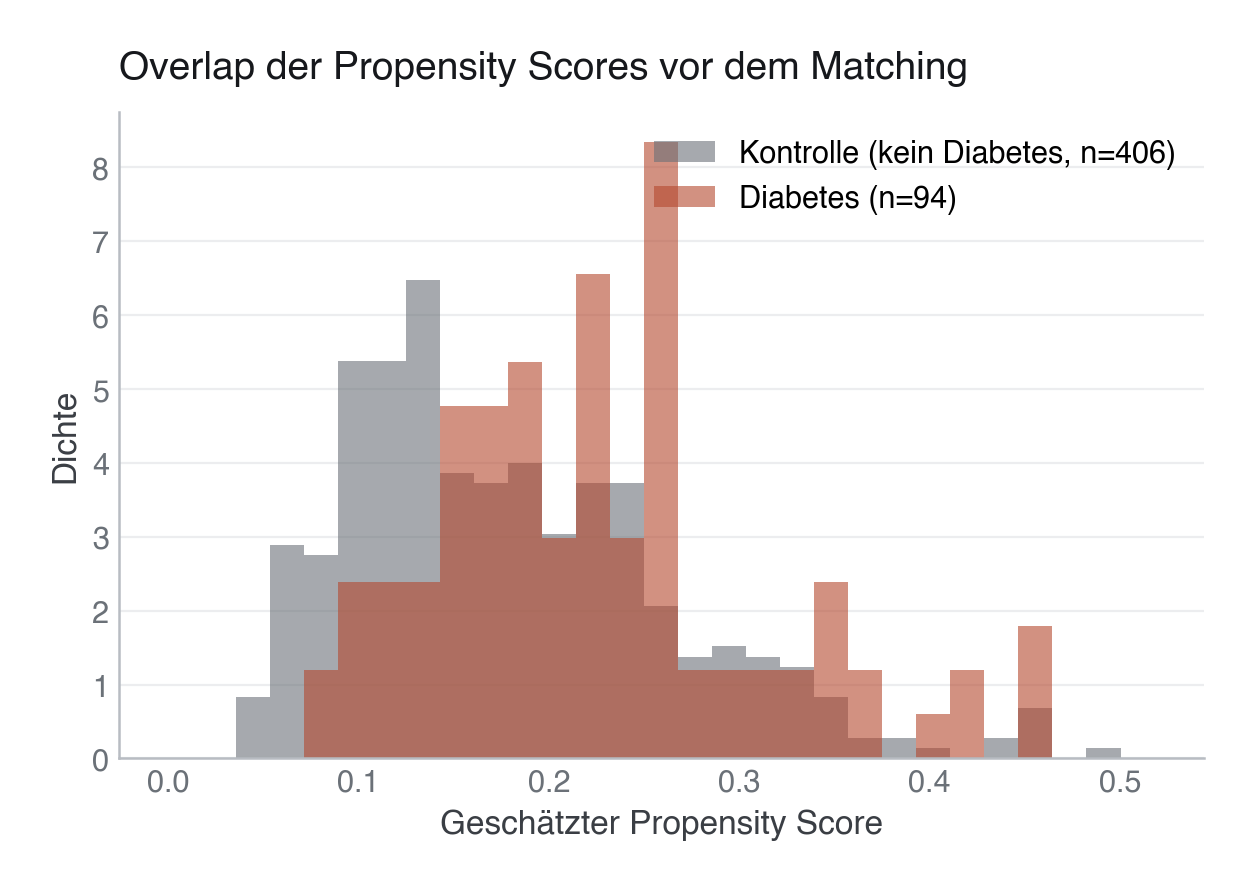
Erzeugt von fig_ps_overlap() in module/19-propensity-score-causal/code/figures.py, Zeile 84–95.
Python
Python-Code: in eine Datei mit Endung
.py schreiben und mit dem ▶-Knopf in VS Code ausführen – oder Zeile für Zeile in die Python-Konsole. Setzt die in Modul 02 eingerichtete Umgebung voraus.def fig_ps_overlap(df) -> None: fig, ax = plt.subplots(figsize=(7, 4.2)) bins = np.linspace(0, df["ps"].max() * 1.05, 30) ax.hist(df.loc[df[TREATMENT] == 0, "ps"], bins=bins, color=SECONDARY, alpha=0.6, label=f"Kontrolle (kein Diabetes, n={int((df[TREATMENT] == 0).sum())})", density=True) ax.hist(df.loc[df[TREATMENT] == 1, "ps"], bins=bins, color=EVENT, alpha=0.6, label=f"Diabetes (n={int((df[TREATMENT] == 1).sum())})", density=True) ax.set_xlabel("Geschätzter Propensity Score") ax.set_ylabel("Dichte") ax.set_title("Overlap der Propensity Scores vor dem Matching") ax.legend(loc="upper right") save(fig, ASSETS / "ps_overlap.png")