20 · Konkurrierende Risiken und zeitabhängige Cox-Modelle
cif_vs_naive_km.png
Abbildung · Quellcode
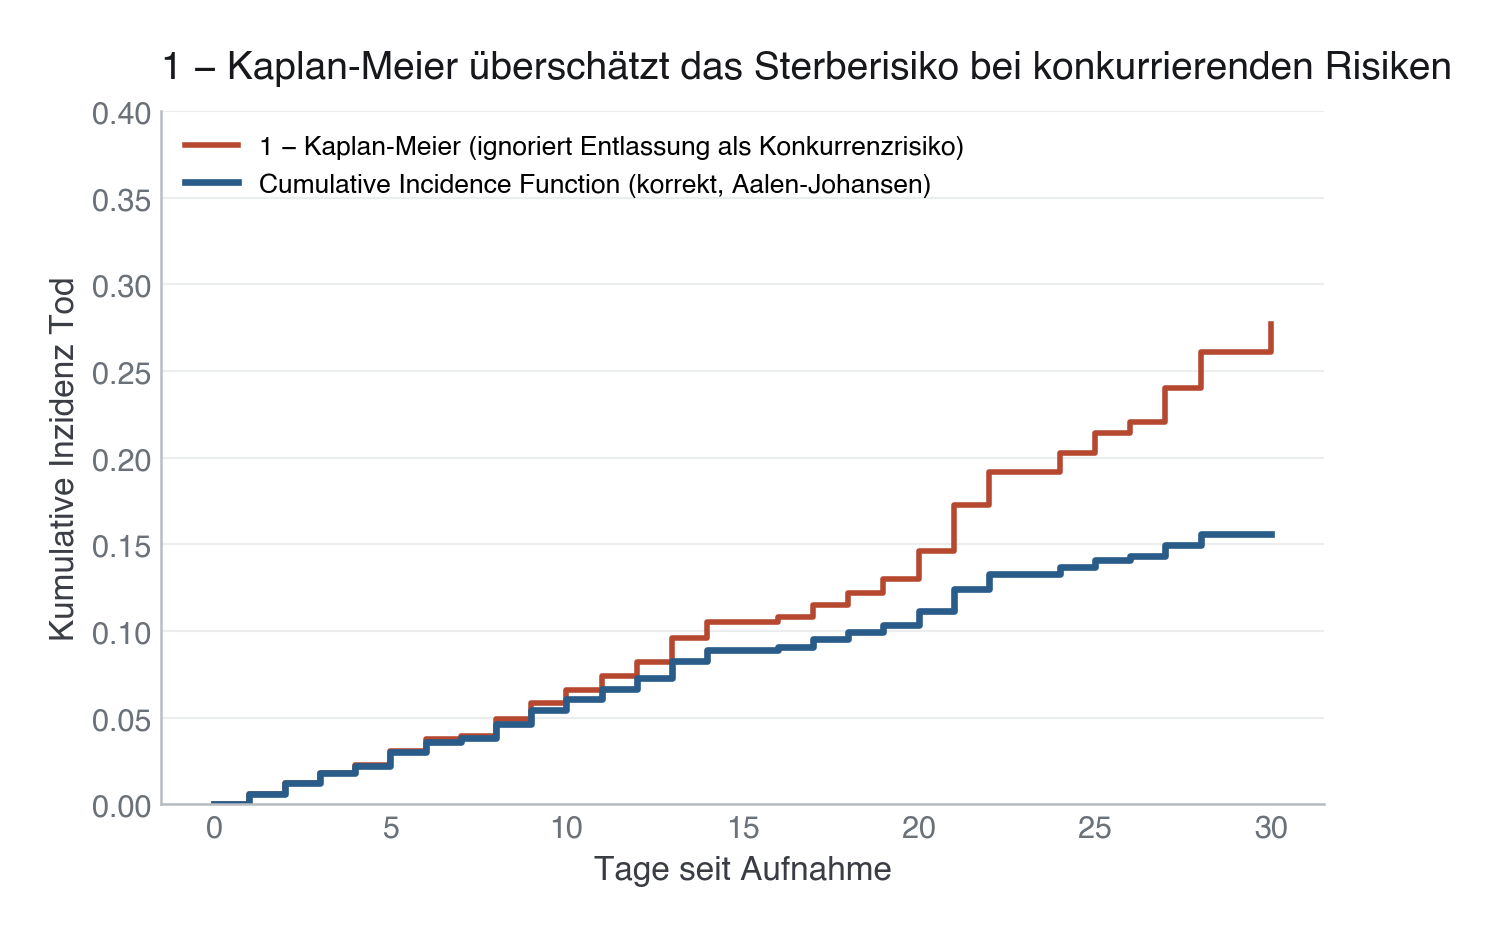
Erzeugt von fig_cif_vs_naive_km() in module/20-competing-risks-timevariant/code/figures.py, Zeile 27–51.
Python
Python-Code: in eine Datei mit Endung
.py schreiben und mit dem ▶-Knopf in VS Code ausführen – oder Zeile für Zeile in die Python-Konsole. Setzt die in Modul 02 eingerichtete Umgebung voraus.def fig_cif_vs_naive_km(df) -> None: with warnings.catch_warnings(): warnings.simplefilter("ignore") # Seeded so the tie-jitter is reproducible; clip the last jittered row # (it can sit just past day 30 with a tiny risk set and spike the curve). ajf = AalenJohansenFitter(seed=SEED) ajf.fit(df["event_time"], df["event_state"], event_of_interest=1) cif = ajf.cumulative_density_.loc[:ADMIN_HORIZON] kmf = KaplanMeierFitter() kmf.fit(df["event_time"], event_observed=(df["event_state"] == 1)) naive_cif = (1 - kmf.survival_function_).loc[:ADMIN_HORIZON] fig, ax = plt.subplots(figsize=(7.5, 4.5)) ax.step(naive_cif.index, naive_cif.values.ravel(), where="post", color=EVENT, lw=2, label="1 − Kaplan-Meier (ignoriert Entlassung als Konkurrenzrisiko)") ax.step(cif.index, cif.values.ravel(), where="post", color=PRIMARY, lw=2.4, label="Cumulative Incidence Function (korrekt, Aalen-Johansen)") ax.set_xlabel("Tage seit Aufnahme") ax.set_ylabel("Kumulative Inzidenz Tod") ax.set_ylim(0, 0.40) ax.set_title("1 − Kaplan-Meier überschätzt das Sterberisiko bei konkurrierenden Risiken") ax.legend(loc="upper left", fontsize=9.5) save(fig, ASSETS / "cif_vs_naive_km.png")