23 · Einführung in das maschinelle Lernen
kalibrierung.png
Abbildung · Quellcode
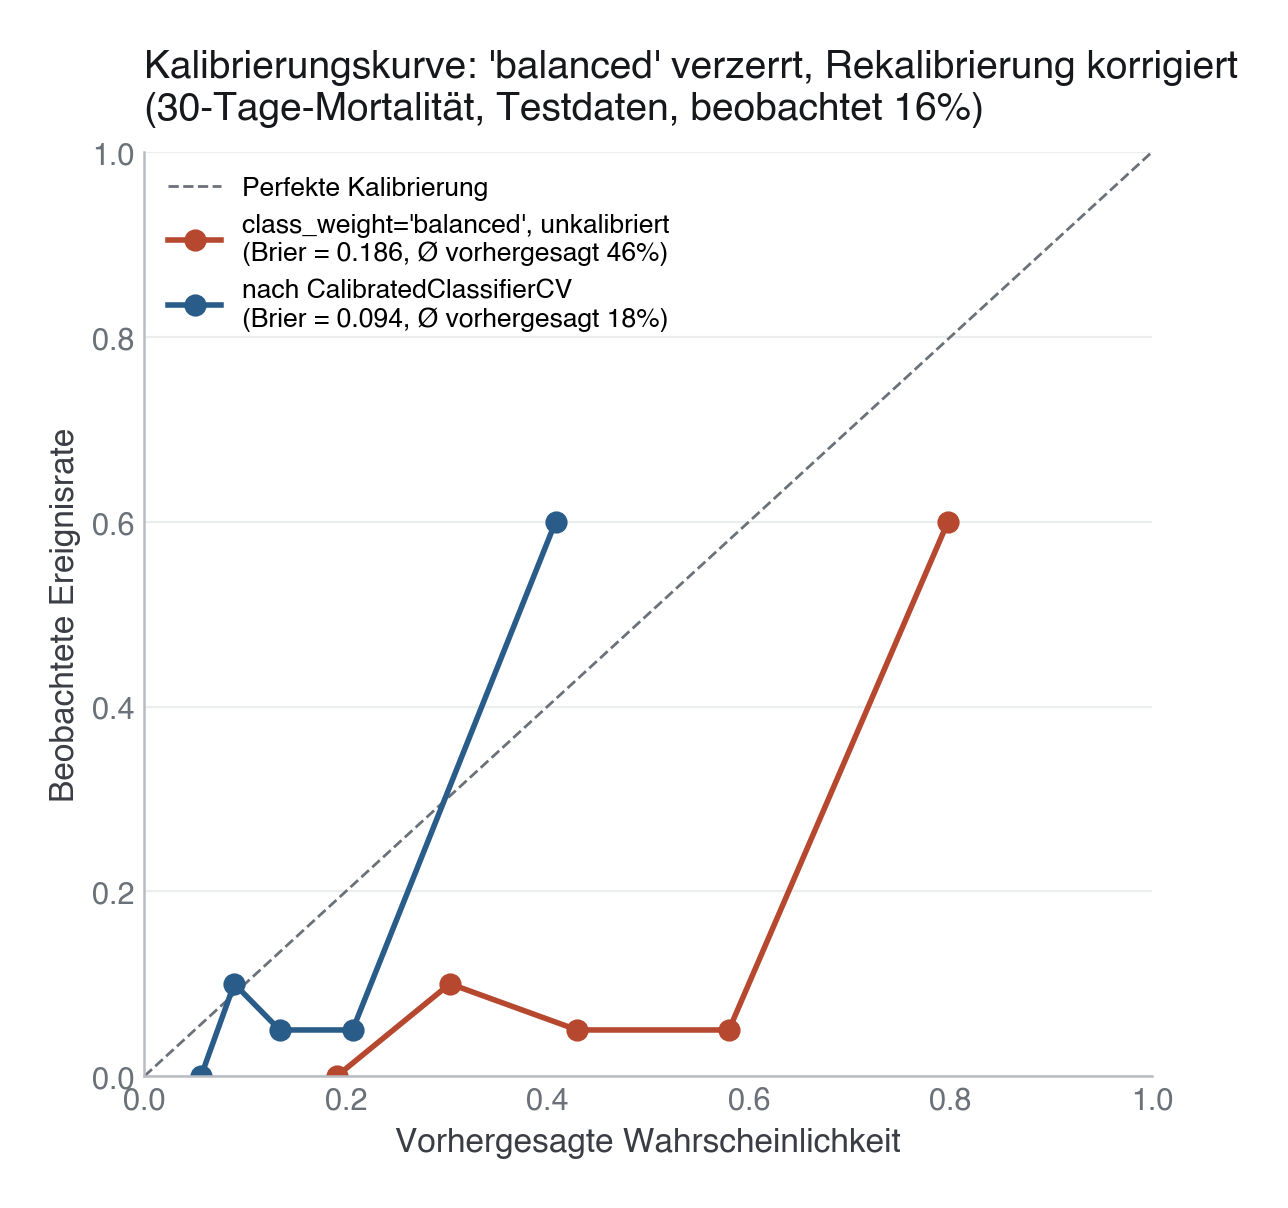
Erzeugt von fig_calibration() in module/23-machine-learning/code/figures.py, Zeile 58–82.
Python
Python-Code: in eine Datei mit Endung
.py schreiben und mit dem ▶-Knopf in VS Code ausführen – oder Zeile für Zeile in die Python-Konsole. Setzt die in Modul 02 eingerichtete Umgebung voraus.def fig_calibration(y_test, proba_raw, proba_cal) -> None: """Calibration curve: class_weight='balanced' distorts predict_proba(), and CalibratedClassifierCV fixes it. Shown side by side so the effect is visible directly, not just asserted in prose. See Module 25 for the full calibration-in-the-large/slope/DCA workflow that builds on this.""" brier_raw = brier_score_loss(y_test, proba_raw) brier_cal = brier_score_loss(y_test, proba_cal) frac_raw, mean_raw = calibration_curve(y_test, proba_raw, n_bins=5, strategy="quantile") frac_cal, mean_cal = calibration_curve(y_test, proba_cal, n_bins=5, strategy="quantile") fig, ax = plt.subplots(figsize=(6.5, 6)) ax.plot([0, 1], [0, 1], color=SECONDARY, linestyle="--", linewidth=1.0, label="Perfekte Kalibrierung") ax.plot(mean_raw, frac_raw, "o-", color=EVENT, linewidth=2.0, markersize=7, label=f"class_weight='balanced', unkalibriert\n(Brier = {brier_raw:.3f}, Ø vorhergesagt {proba_raw.mean():.0%})") ax.plot(mean_cal, frac_cal, "o-", color=PRIMARY, linewidth=2.0, markersize=7, label=f"nach CalibratedClassifierCV\n(Brier = {brier_cal:.3f}, Ø vorhergesagt {proba_cal.mean():.0%})") ax.set_xlabel("Vorhergesagte Wahrscheinlichkeit") ax.set_ylabel("Beobachtete Ereignisrate") ax.set_title("Kalibrierungskurve: 'balanced' verzerrt, Rekalibrierung korrigiert\n" f"(30-Tage-Mortalität, Testdaten, beobachtet {y_test.mean():.0%})") ax.legend(loc="upper left", fontsize=9.5) ax.set_xlim(0, 1) ax.set_ylim(0, 1) save(fig, ASSETS / "kalibrierung.png")