24 · Workflow für Prädiktionsmodelle und Data Leakage
schwellenwahl.png
Abbildung · Quellcode
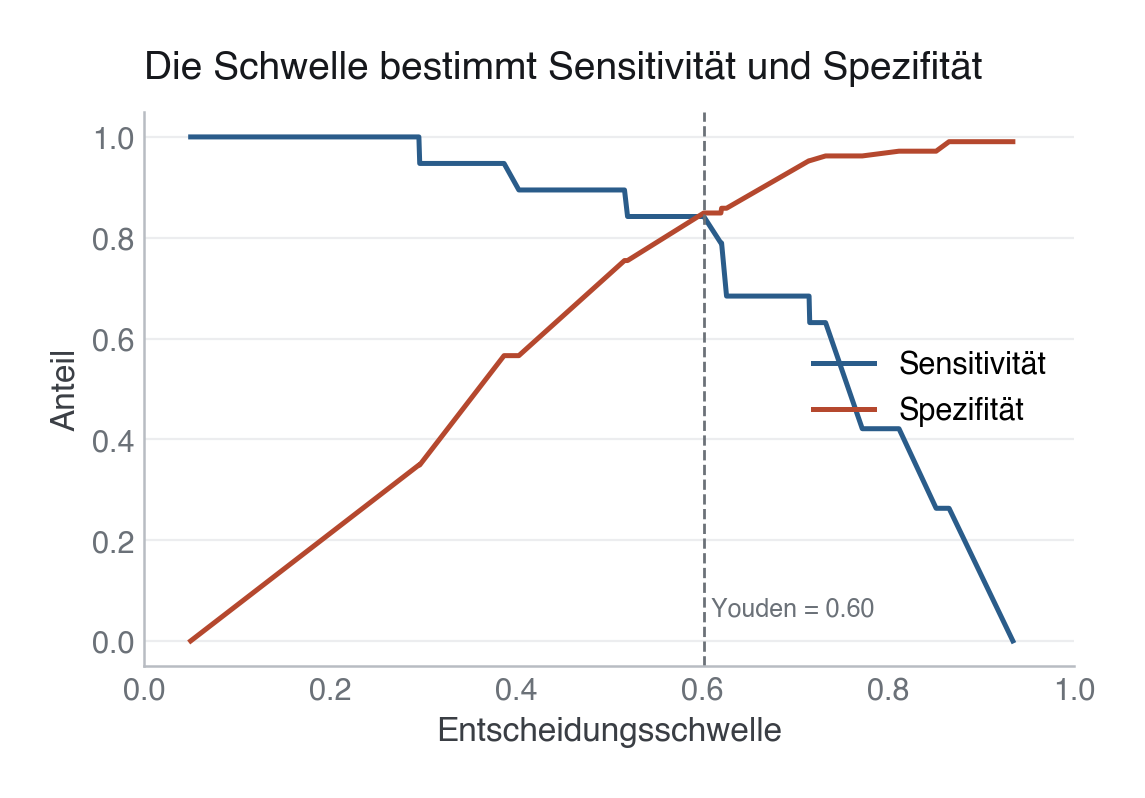
Erzeugt von fig_threshold() in module/24-praediktion-workflow/code/figures.py, Zeile 51–65.
Python
Python-Code: in eine Datei mit Endung
.py schreiben und mit dem ▶-Knopf in VS Code ausführen – oder Zeile für Zeile in die Python-Konsole. Setzt die in Modul 02 eingerichtete Umgebung voraus.def fig_threshold(proba, y_test): fpr, tpr, thr = roc_curve(y_test, proba) sens, spec = tpr, 1 - fpr youden = int(np.argmax(tpr - fpr)) fig, ax = plt.subplots(figsize=(6, 3.6)) ax.plot(thr, sens, color=PRIMARY, label="Sensitivität") ax.plot(thr, spec, color=EVENT, label="Spezifität") ax.axvline(thr[youden], color=SECONDARY, ls="--", lw=1) ax.text(thr[youden], 0.05, f" Youden = {thr[youden]:.2f}", color=SECONDARY, fontsize=9) ax.set_xlim(0, 1) ax.set_xlabel("Entscheidungsschwelle") ax.set_ylabel("Anteil") ax.set_title("Die Schwelle bestimmt Sensitivität und Spezifität") ax.legend(loc="center right") save(fig, ASSETS / "schwellenwahl.png")