27 · Erklärbarkeit von Machine-Learning-Modellen
partial_dependence.png
Abbildung · Quellcode
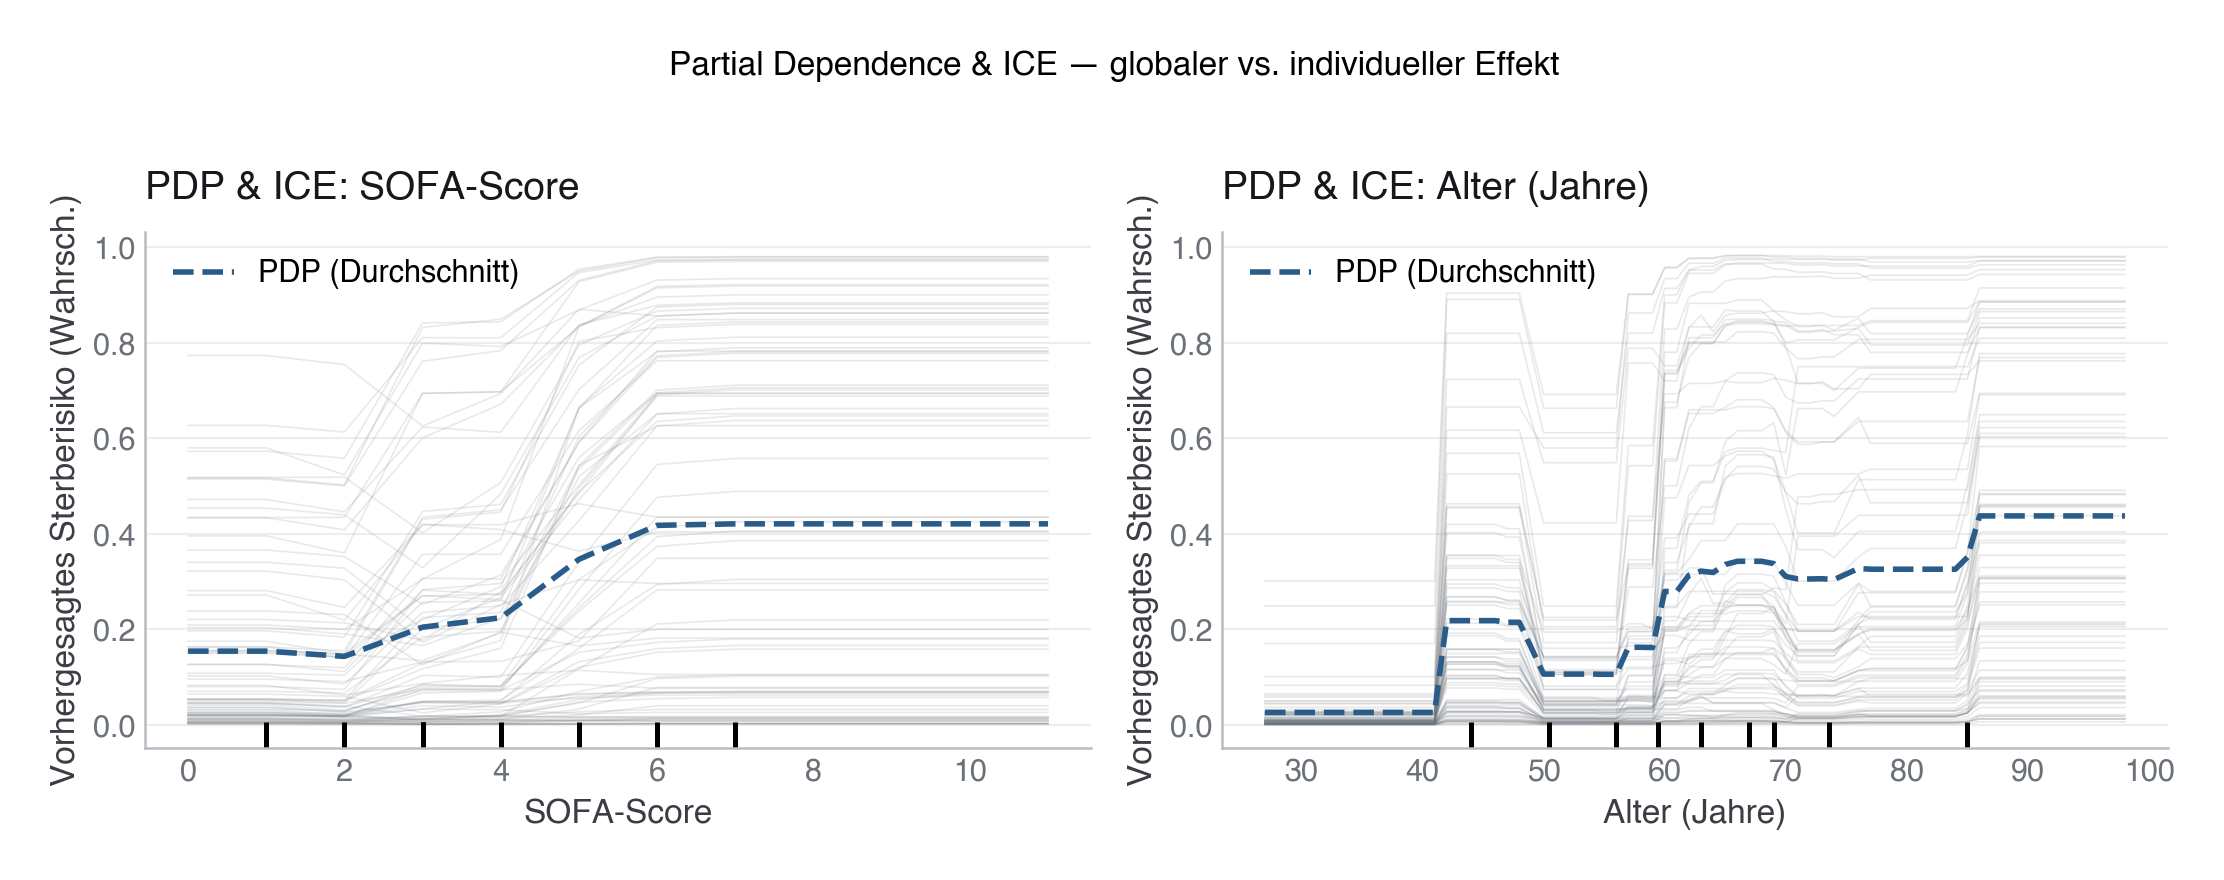
Erzeugt von fig_partial_dependence() in module/27-erklaerbarkeit/code/figures.py, Zeile 103–131.
Python
Python-Code: in eine Datei mit Endung
.py schreiben und mit dem ▶-Knopf in VS Code ausführen – oder Zeile für Zeile in die Python-Konsole. Setzt die in Modul 02 eingerichtete Umgebung voraus.def fig_partial_dependence(model, X_test: pd.DataFrame) -> None: """PDP + ICE for sofa_score and alter in a two-panel figure.""" fig, axes = plt.subplots(1, 2, figsize=(11, 4)) # PartialDependenceDisplay uses feature names if X is a DataFrame. # NOTE: use "linewidth", not the "lw" alias -- newer matplotlib raises # "Got both 'linewidth' and 'lw'" if PartialDependenceDisplay's internal # defaults and our kwargs use different aliases for the same property. display = PartialDependenceDisplay.from_estimator( model, X_test, features=["sofa_score", "alter"], kind="both", # "average" = PDP only; "both" adds ICE lines subsample=80, random_state=SEED, ax=axes, line_kw={"color": PRIMARY, "linewidth": 2.0, "label": "PDP (Durchschnitt)"}, ice_lines_kw={"color": SECONDARY, "alpha": 0.15, "linewidth": 0.6}, ) titles = ["SOFA-Score", "Alter (Jahre)"] for i, ax in enumerate(axes): ax.set_title(f"PDP & ICE: {titles[i]}") ax.set_ylabel("Vorhergesagtes Sterberisiko (Wahrsch.)") ax.set_xlabel(titles[i]) fig.suptitle("Partial Dependence & ICE — globaler vs. individueller Effekt", fontsize=12, fontweight="bold", y=1.02) fig.tight_layout() save(fig, ASSETS / "partial_dependence.png")