27 · Erklärbarkeit von Machine-Learning-Modellen
permutation_importance.png
Abbildung · Quellcode
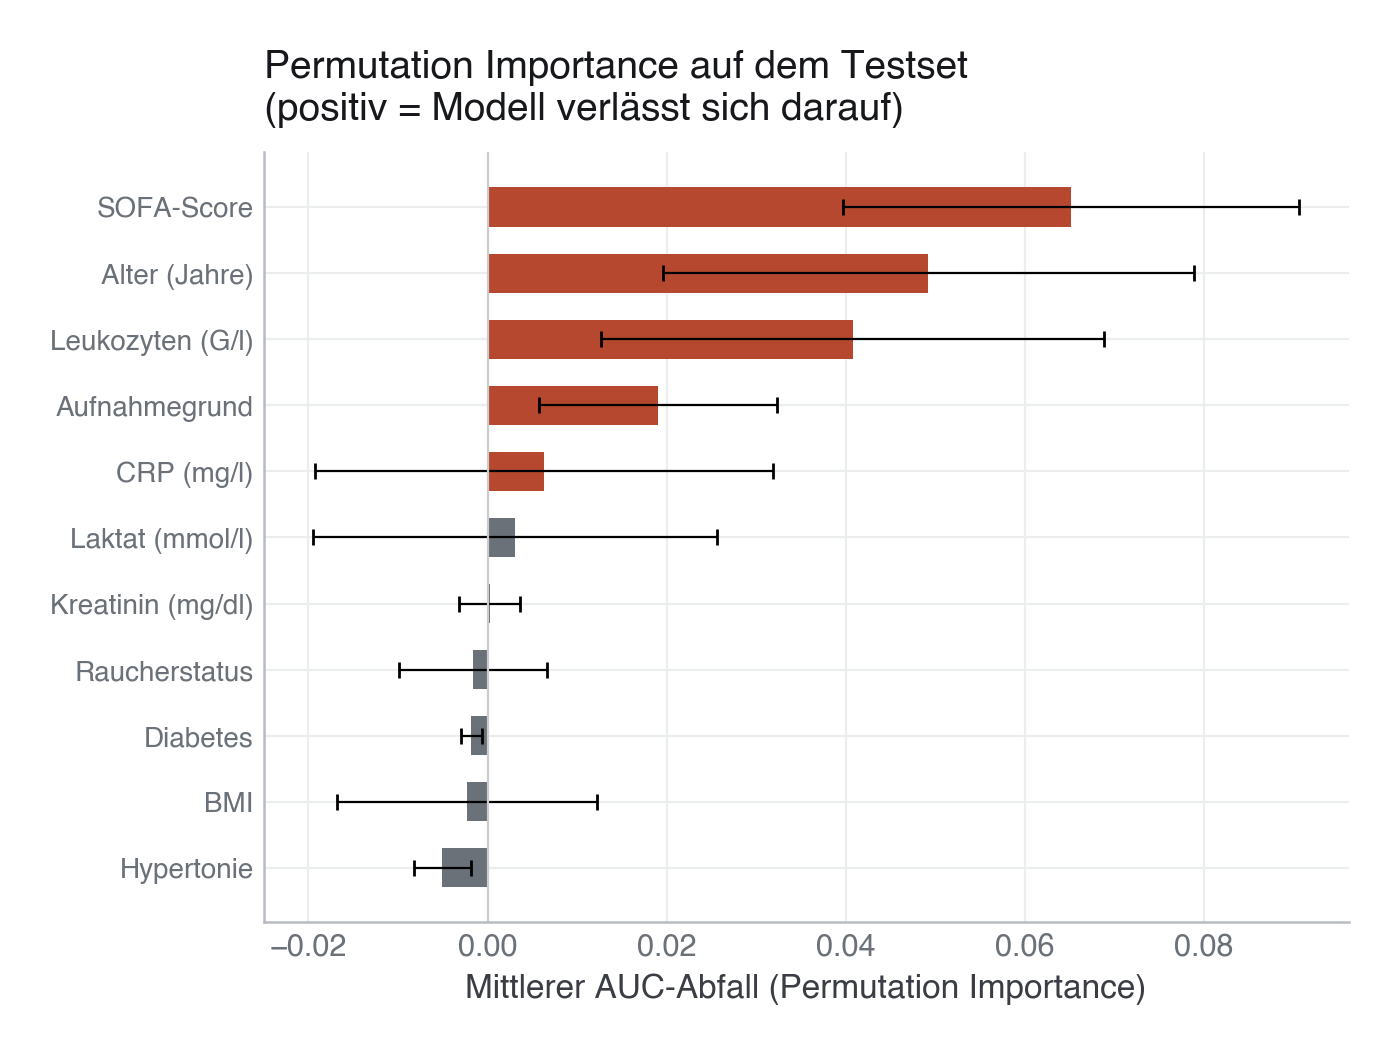
Erzeugt von fig_permutation_importance() in module/27-erklaerbarkeit/code/figures.py, Zeile 56–100.
Python
Python-Code: in eine Datei mit Endung
.py schreiben und mit dem ▶-Knopf in VS Code ausführen – oder Zeile für Zeile in die Python-Konsole. Setzt die in Modul 02 eingerichtete Umgebung voraus.def fig_permutation_importance(model, X_test: pd.DataFrame, y_test: pd.Series) -> None: """Horizontal bar chart of permutation importance with error bars.""" result = permutation_importance( model, X_test, y_test, n_repeats=10, random_state=SEED, scoring="roc_auc", n_jobs=1, ) means = result.importances_mean stds = result.importances_std # Sort ascending so the most important feature appears at the top. order = np.argsort(means) sorted_names = [FEATURES[i] for i in order] sorted_means = means[order] sorted_stds = stds[order] # German-friendly feature label mapping. label_map = { "alter": "Alter (Jahre)", "sofa_score": "SOFA-Score", "crp_mg_l": "CRP (mg/l)", "bmi": "BMI", "leukozyten_g_l": "Leukozyten (G/l)", "kreatinin_mg_dl": "Kreatinin (mg/dl)", "laktat_mmol_l": "Laktat (mmol/l)", "aufnahmegrund": "Aufnahmegrund", "raucherstatus": "Raucherstatus", "diabetes": "Diabetes", "hypertonie": "Hypertonie", } display_names = [label_map.get(n, n) for n in sorted_names] colors = [EVENT if m > 0.005 else SECONDARY for m in sorted_means] fig, ax = plt.subplots(figsize=(7, 5)) y_pos = np.arange(len(sorted_names)) ax.barh(y_pos, sorted_means, xerr=sorted_stds, color=colors, height=0.6, error_kw={"linewidth": 0.8, "capsize": 3}) ax.axvline(0, color="#CCCCCC", lw=0.8) ax.set_yticks(y_pos) ax.set_yticklabels(display_names, fontsize=10) ax.set_xlabel("Mittlerer AUC-Abfall (Permutation Importance)") ax.set_title("Permutation Importance auf dem Testset\n(positiv = Modell verlässt sich darauf)") ax.grid(axis="x") save(fig, ASSETS / "permutation_importance.png")