27 · Erklärbarkeit von Machine-Learning-Modellen
shap_beeswarm.png
Abbildung · Quellcode
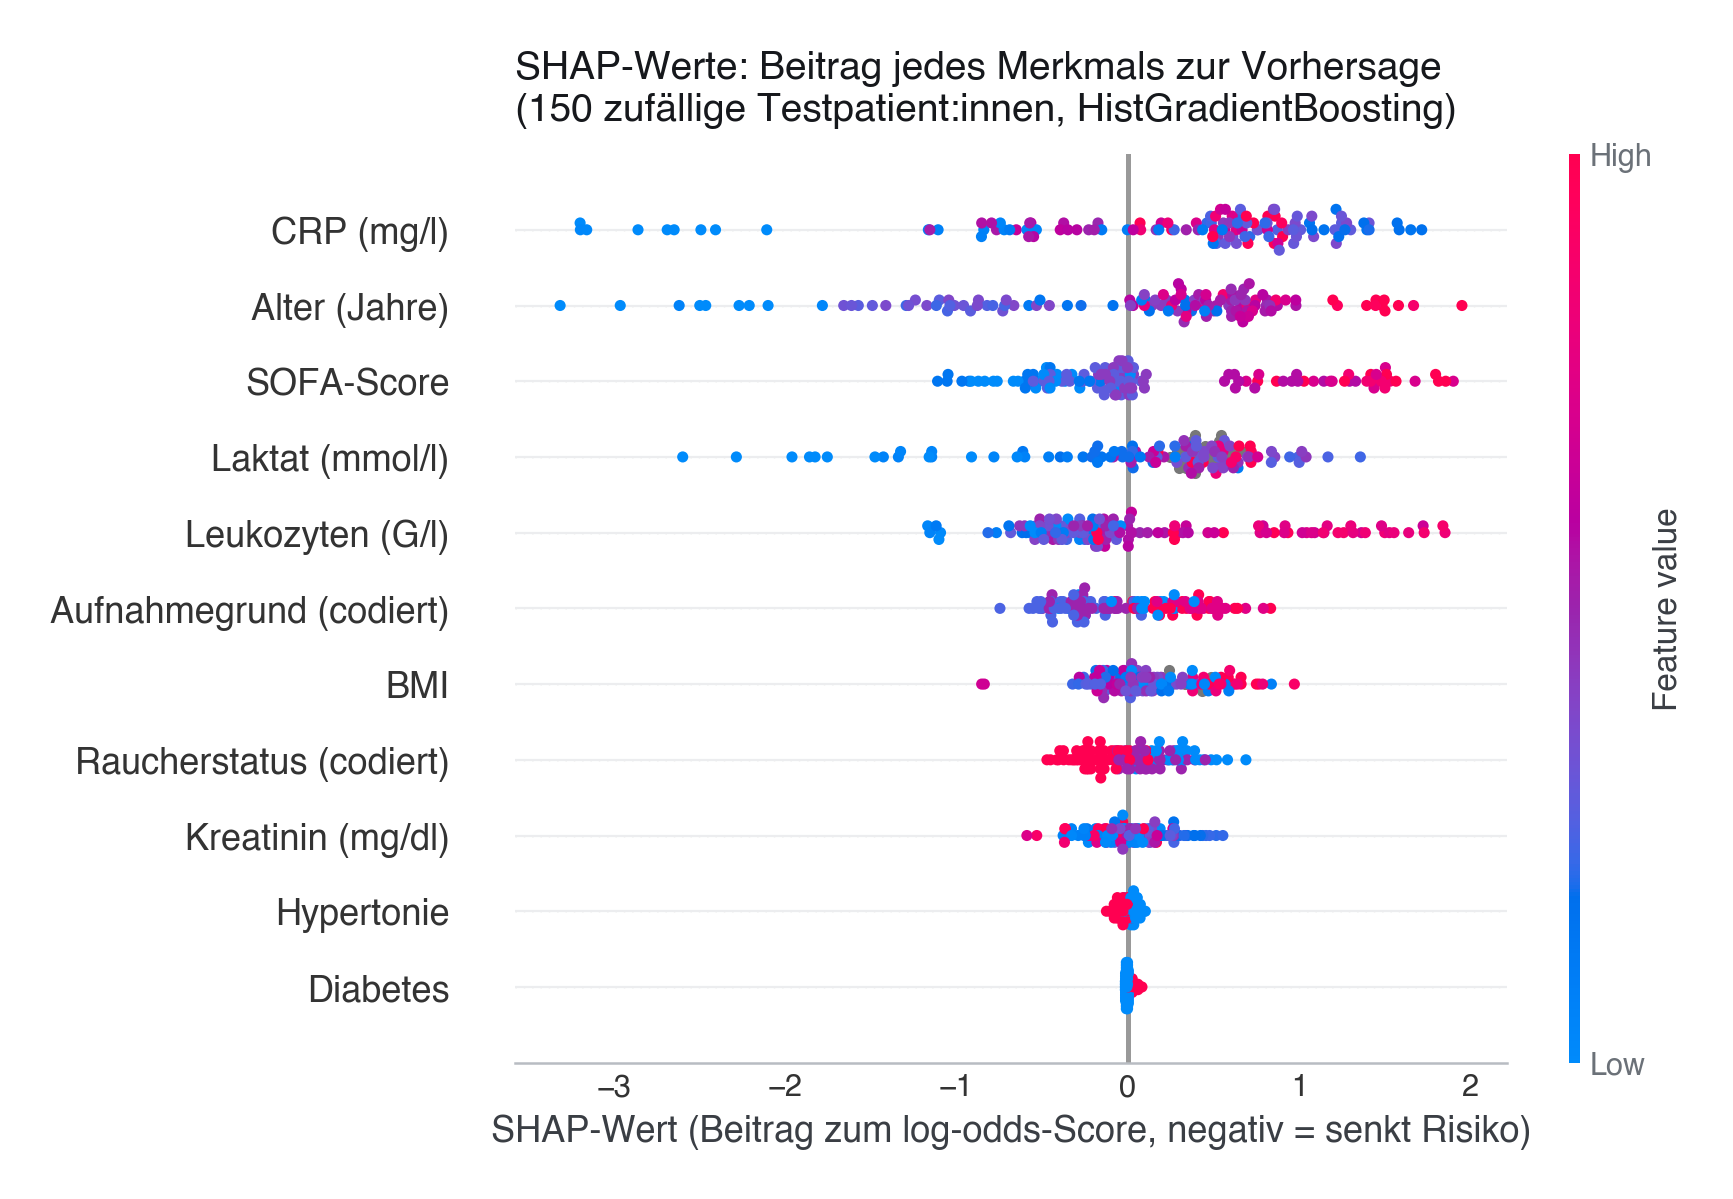
Erzeugt von fig_shap_beeswarm() in module/27-erklaerbarkeit/code/figures.py, Zeile 149–179.
Python
Python-Code: in eine Datei mit Endung
.py schreiben und mit dem ▶-Knopf in VS Code ausführen – oder Zeile für Zeile in die Python-Konsole. Setzt die in Modul 02 eingerichtete Umgebung voraus.def fig_shap_beeswarm(model, X_train: pd.DataFrame, X_test: pd.DataFrame) -> bool: """SHAP beeswarm summary plot. Returns True if shap was available and the figure was generated, False if shap is not installed (caller can skip the README reference / print a note instead of failing).""" try: import shap except ImportError: print(" shap not installed -- skipping shap_beeswarm.png " "(install: uv pip install shap)") return False explainer = shap.Explainer(model, X_train) # check_additivity=False: see code/python.py for why this is needed with # HistGradientBoostingClassifier + class_weight="balanced". shap_values = explainer(X_test.iloc[:150], check_additivity=False) shap_values.feature_names = [LABEL_MAP.get(f, f) for f in FEATURES] fig = plt.figure(figsize=(7.5, 5.5)) # beeswarm jitters overlapping points vertically and draws that jitter from # numpy's GLOBAL RNG, which nothing else in this file seeds. Without this the # figure differs on every run and the committed PNG is never reproducible. np.random.seed(SEED) shap.plots.beeswarm(shap_values, show=False, max_display=11) ax = plt.gca() ax.set_title("SHAP-Werte: Beitrag jedes Merkmals zur Vorhersage\n" "(150 zufällige Testpatient:innen, HistGradientBoosting)", loc="left", fontweight="bold") ax.set_xlabel("SHAP-Wert (Beitrag zum log-odds-Score, negativ = senkt Risiko)") fig = plt.gcf() save(fig, ASSETS / "shap_beeswarm.png") return True