28 · Maschinelles Lernen für Überlebenszeiten
rsf_vs_cox.png
Abbildung · Quellcode
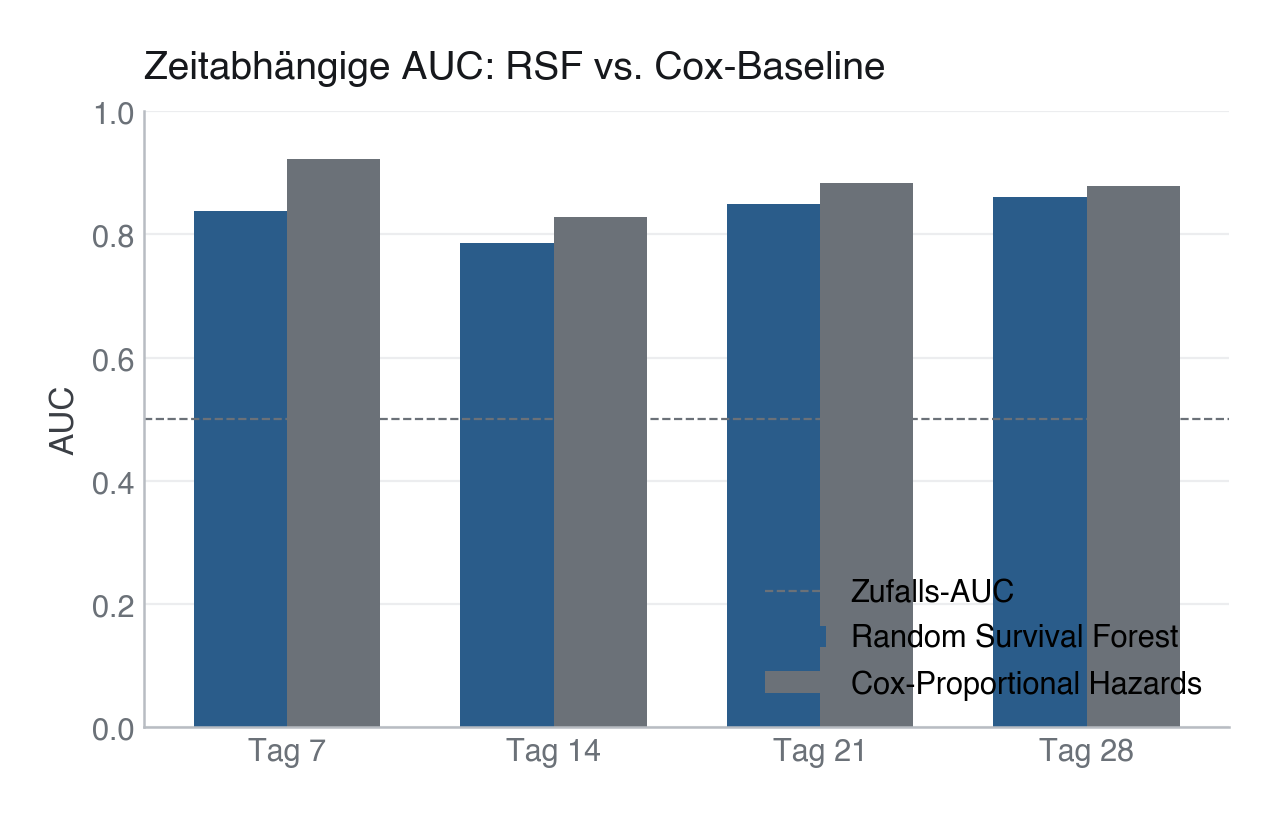
Erzeugt von fig_rsf_vs_cox() in module/28-survival-ml/code/figures.py, Zeile 72–135.
Python
Python-Code: in eine Datei mit Endung
.py schreiben und mit dem ▶-Knopf in VS Code ausführen – oder Zeile für Zeile in die Python-Konsole. Setzt die in Modul 02 eingerichtete Umgebung voraus.def fig_rsf_vs_cox(X_tr_np, X_te_np, events_train, events_test, times_train, times_test) -> None: """Time-dependent AUC comparison (RSF vs. Cox) or fallback bar chart.""" fig, ax = plt.subplots(figsize=(7, 4)) cox_scores = cox_risk_scores(X_tr_np, X_te_np, events_train, times_train) try: from sksurv.ensemble import RandomSurvivalForest from sksurv.metrics import cumulative_dynamic_auc surv_train = make_survival_array(events_train, times_train) surv_test = make_survival_array(events_test, times_test) rsf = RandomSurvivalForest(n_estimators=200, min_samples_leaf=10, random_state=SEED, n_jobs=-1) rsf.fit(X_tr_np, surv_train) chf_funcs = rsf.predict_cumulative_hazard_function(X_te_np, return_array=False) rsf_scores = np.array([fn(28) for fn in chf_funcs]) # cumulative_dynamic_auc needs the FULL test survival array + full # score array in a single call (it builds the risk set per time point # internally). Masking surv_test/scores per-t corrupts the array's # time range and raises "times must be within follow-up time of test # data" for later time points. Requested times must be strictly below # the largest observed test follow-up time. valid_times = [t for t in TIMES if t < times_test.max()] auc_rsf_list, _ = cumulative_dynamic_auc( surv_train, surv_test, rsf_scores, valid_times) auc_cox_list, _ = cumulative_dynamic_auc( surv_train, surv_test, cox_scores, valid_times) x = np.arange(len(valid_times)) width = 0.35 ax.bar(x - width / 2, auc_rsf_list, width, color=PRIMARY, label="Random Survival Forest") ax.bar(x + width / 2, auc_cox_list, width, color=SECONDARY, label="Cox-Proportional Hazards") ax.set_xticks(x) ax.set_xticklabels([f"Tag {t}" for t in valid_times]) ax.set_title("Zeitabhängige AUC: RSF vs. Cox-Baseline") except ImportError as exc: # scikit-survival is a required dependency for this figure — the # RSF-vs-Cox time-dependent AUC comparison is the whole point of the # chart, so silently degrading to a different chart (with a mismatched # caption) is worse than failing loudly. Install scikit-survival and # re-run instead of relying on a fallback here. plt.close(fig) raise SystemExit( "scikit-survival (sksurv) is required to generate rsf_vs_cox.png " "— install it with `pip install scikit-survival` and re-run. " "This figure specifically compares RSF vs. Cox time-dependent AUC; " "there is no meaningful fallback chart for that comparison." ) from exc ax.set_ylim(0, 1) ax.axhline(0.5, color=SECONDARY, lw=0.8, ls="--", label="Zufalls-AUC") ax.set_ylabel("AUC") # AUC values sit high (~0.8-0.9) in this cohort, so the legend goes in the # empty lower-right area instead of the default placement (which overlaps # the bars). ax.legend(loc="lower right") save(fig, ASSETS / "rsf_vs_cox.png")