29 · Unüberwachtes Lernen und Phänotypisierung von Patient:innen
silhouette_k.png
Abbildung · Quellcode
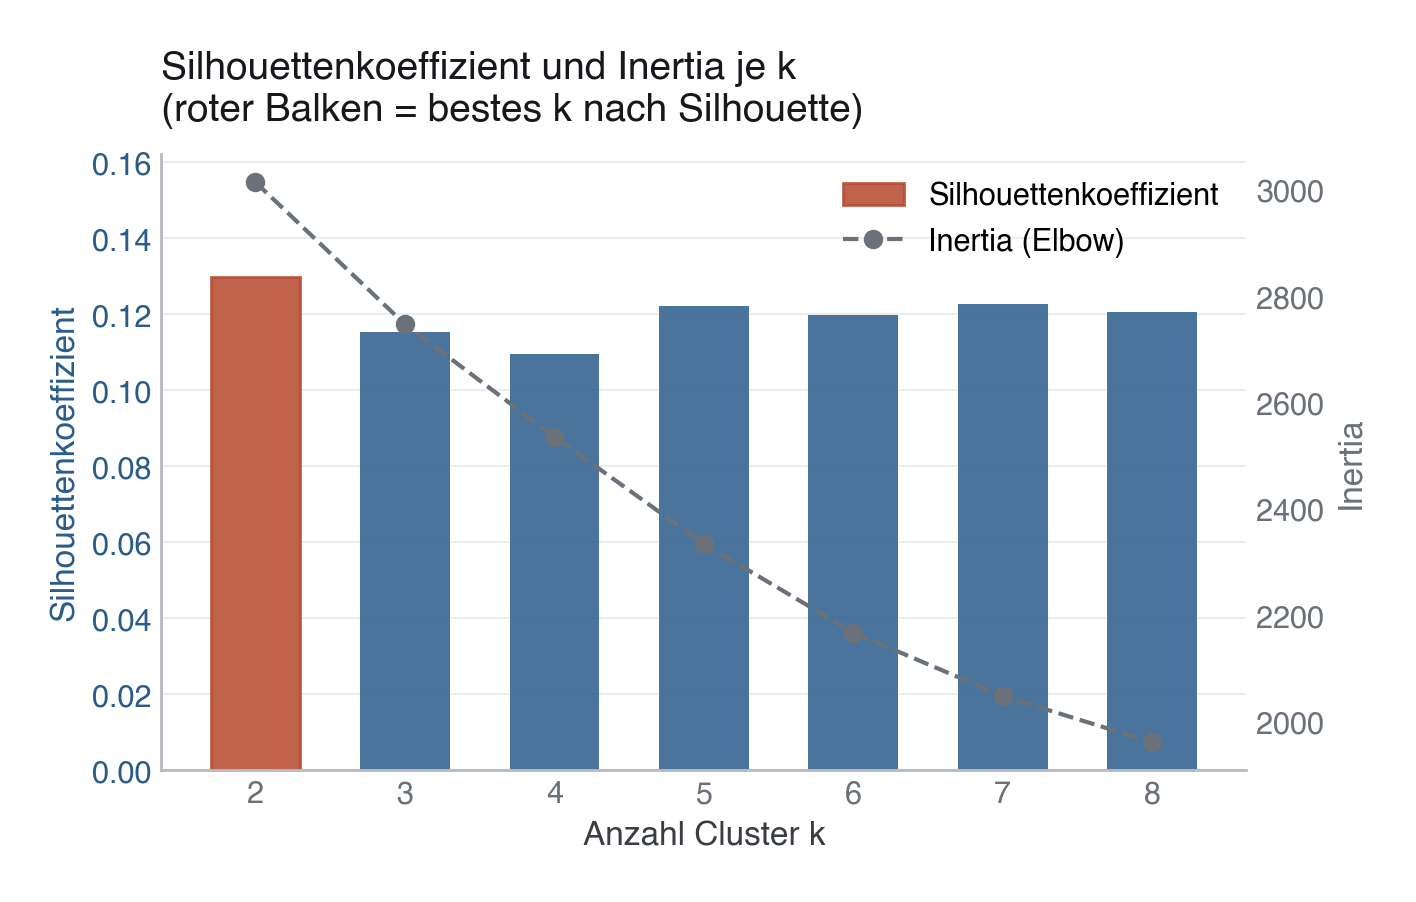
Erzeugt von fig_silhouette_k() in module/29-unueberwacht-phenotyping/code/figures.py, Zeile 46–84.
Python
Python-Code: in eine Datei mit Endung
.py schreiben und mit dem ▶-Knopf in VS Code ausführen – oder Zeile für Zeile in die Python-Konsole. Setzt die in Modul 02 eingerichtete Umgebung voraus.def fig_silhouette_k(X: np.ndarray) -> None: """Bar chart of silhouette scores for k = 2..8, plus inertia on twin axis.""" k_values = list(range(2, 9)) silhouettes, inertias = [], [] for k in k_values: km = KMeans(n_clusters=k, random_state=SEED, n_init=10) labels = km.fit_predict(X) silhouettes.append(silhouette_score(X, labels)) inertias.append(km.inertia_) fig, ax1 = plt.subplots(figsize=(7, 4)) bars = ax1.bar(k_values, silhouettes, color=PRIMARY, alpha=0.85, width=0.6, label="Silhouettenkoeffizient") # Highlight the best k best_idx = int(np.argmax(silhouettes)) bars[best_idx].set_color(EVENT) ax1.set_xlabel("Anzahl Cluster k") ax1.set_ylabel("Silhouettenkoeffizient", color=PRIMARY) ax1.tick_params(axis="y", labelcolor=PRIMARY) ax1.set_ylim(0, max(silhouettes) * 1.25) ax1.set_xticks(k_values) ax2 = ax1.twinx() ax2.plot(k_values, inertias, color=SECONDARY, marker="o", lw=1.5, linestyle="--", label="Inertia (Elbow)") ax2.set_ylabel("Inertia", color=SECONDARY) ax2.tick_params(axis="y", labelcolor=SECONDARY) ax2.grid(False) ax1.set_title("Silhouettenkoeffizient und Inertia je k\n" "(roter Balken = bestes k nach Silhouette)") # Combined legend lines1, labels1 = ax1.get_legend_handles_labels() lines2, labels2 = ax2.get_legend_handles_labels() ax1.legend(lines1 + lines2, labels1 + labels2, loc="upper right") save(fig, ASSETS / "silhouette_k.png")