30 · Neuronale Netze und Deep Learning
auc_vergleich.png
Abbildung · Quellcode
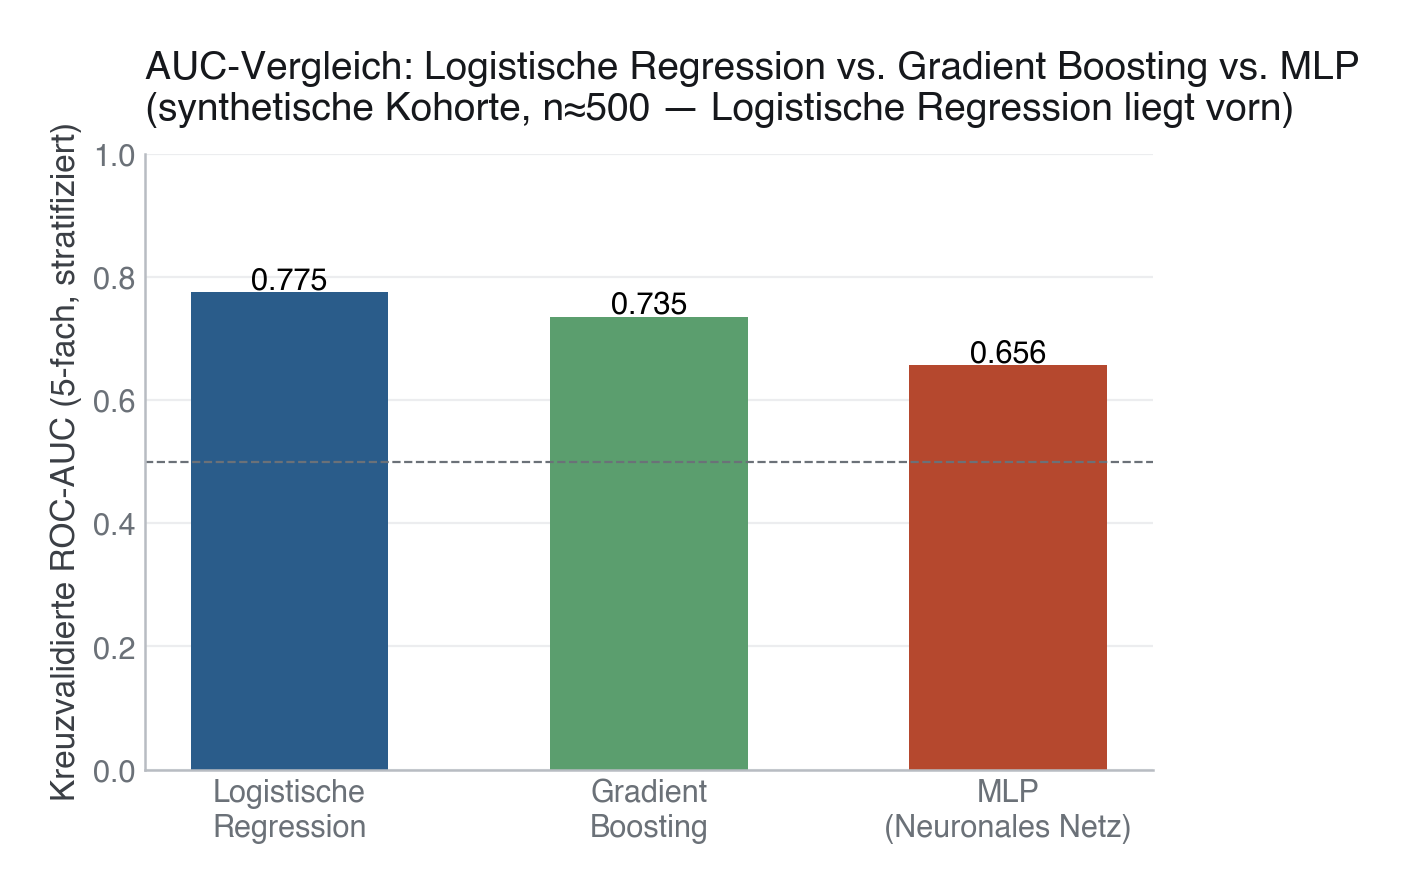
Erzeugt von fig_auc_vergleich() in module/30-deep-learning/code/figures.py, Zeile 106–170.
Python
Python-Code: in eine Datei mit Endung
.py schreiben und mit dem ▶-Knopf in VS Code ausführen – oder Zeile für Zeile in die Python-Konsole. Setzt die in Modul 02 eingerichtete Umgebung voraus.def fig_auc_vergleich(X, y) -> None: """Bar chart comparing 5-fold CV AUC: LR vs GB vs MLP.""" cv = StratifiedKFold(n_splits=5, shuffle=True, random_state=SEED) def lr_pipe(): return Pipeline([("pre", build_preprocessor()), ("clf", LogisticRegression(max_iter=1000, class_weight="balanced", random_state=SEED))]) def gb_pipe(): return Pipeline([("pre", build_preprocessor()), ("clf", GradientBoostingClassifier(n_estimators=200, max_depth=3, random_state=SEED))]) def mlp_pipe(): # early_stopping=False for CV: avoids shrinking each fold's training set # max_iter=500 prevents ConvergenceWarnings on this small dataset return Pipeline([("pre", build_preprocessor()), ("mlp", MLPClassifier(hidden_layer_sizes=(64, 32), alpha=0.01, early_stopping=False, max_iter=500, random_state=SEED))]) models = [ ("Logistische\nRegression", lr_pipe(), PRIMARY), ("Gradient\nBoosting", gb_pipe(), PALETTE[2]), ("MLP\n(Neuronales Netz)", mlp_pipe(), EVENT), ] names, aucs, colors = [], [], [] for name, pipe, color in models: scores = cross_val_score(pipe, X, y, cv=cv, scoring="roc_auc") names.append(name) aucs.append(scores.mean()) colors.append(color) print(f" {name.replace(chr(10), ' ')}: AUC={scores.mean():.3f}") fig, ax = plt.subplots(figsize=(6.5, 4)) bars = ax.bar(names, aucs, color=colors, width=0.55) for bar, auc in zip(bars, aucs): ax.text(bar.get_x() + bar.get_width() / 2, auc + 0.005, f"{auc:.3f}", ha="center", fontweight="bold", fontsize=11) ax.axhline(0.5, color=SECONDARY, lw=0.8, ls="--") ax.set_ylim(0, 1) ax.set_ylabel("Kreuzvalidierte ROC-AUC (5-fach, stratifiziert)") # Data-driven verdict — NEVER hardcode who "wins": derive it from the # computed aucs so the title can't drift out of sync with the bars. order = sorted(zip(names, aucs), key=lambda t: -t[1]) best_name, best_auc = order[0] runner_up_name, runner_up_auc = order[1] gap = best_auc - runner_up_auc best_flat = best_name.replace("\n", " ") runner_up_flat = runner_up_name.replace("\n", " ") verdict = (f"{best_flat} liegt vorn" if gap > 0.01 else f"{best_flat} und {runner_up_flat} liegen gleichauf") ax.set_title("AUC-Vergleich: Logistische Regression vs. Gradient Boosting vs. MLP\n" f"(synthetische Kohorte, n≈{len(X)} — {verdict})") save(fig, ASSETS / "auc_vergleich.png")