30 · Neuronale Netze und Deep Learning
lernkurve.png
Abbildung · Quellcode
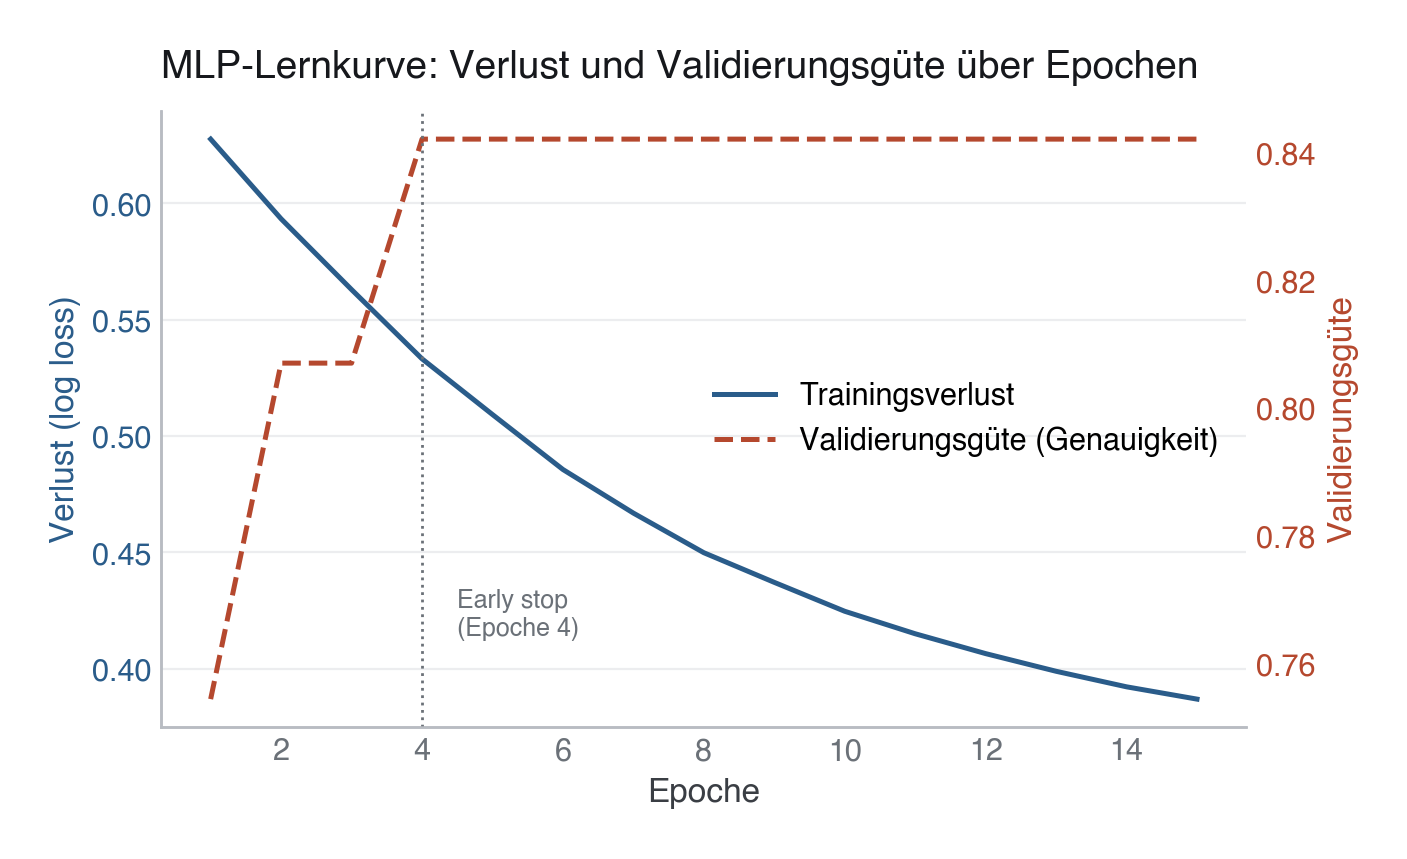
Erzeugt von fig_lernkurve() in module/30-deep-learning/code/figures.py, Zeile 57–103.
Python
Python-Code: in eine Datei mit Endung
.py schreiben und mit dem ▶-Knopf in VS Code ausführen – oder Zeile für Zeile in die Python-Konsole. Setzt die in Modul 02 eingerichtete Umgebung voraus.def fig_lernkurve(X_train, y_train) -> None: """Plot MLP training loss curve and validation accuracy curve.""" mlp_pipe = Pipeline([ ("pre", build_preprocessor()), ("mlp", MLPClassifier( hidden_layer_sizes=(64, 32), activation="relu", alpha=0.01, early_stopping=True, validation_fraction=0.15, max_iter=300, random_state=SEED, )), ]) mlp_pipe.fit(X_train, y_train) mlp = mlp_pipe.named_steps["mlp"] loss_curve = mlp.loss_curve_ val_scores = mlp.validation_scores_ epochs = range(1, len(loss_curve) + 1) fig, ax1 = plt.subplots(figsize=(7, 4)) ax1.plot(epochs, loss_curve, color=PRIMARY, lw=1.8, label="Trainingsverlust") ax1.set_xlabel("Epoche") ax1.set_ylabel("Verlust (log loss)", color=PRIMARY) ax1.tick_params(axis="y", labelcolor=PRIMARY) ax2 = ax1.twinx() ax2.plot(epochs, val_scores, color=EVENT, lw=1.8, linestyle="--", label="Validierungsgüte (Genauigkeit)") ax2.set_ylabel("Validierungsgüte", color=EVENT) ax2.tick_params(axis="y", labelcolor=EVENT) ax2.grid(False) # Mark early-stopping point best_ep = int(np.argmax(val_scores)) + 1 ax2.axvline(best_ep, color=SECONDARY, lw=1, ls=":") ax2.text(best_ep + 0.5, min(val_scores) + 0.01, f"Early stop\n(Epoche {best_ep})", color=SECONDARY, fontsize=9) ax1.set_title("MLP-Lernkurve: Verlust und Validierungsgüte über Epochen") # Combined legend h1, l1 = ax1.get_legend_handles_labels() h2, l2 = ax2.get_legend_handles_labels() ax1.legend(h1 + h2, l1 + l2, loc="center right") save(fig, ASSETS / "lernkurve.png")