31 · Verarbeitung klinischer Freitexte mit LLMs
top_tokens.png
Abbildung · Quellcode
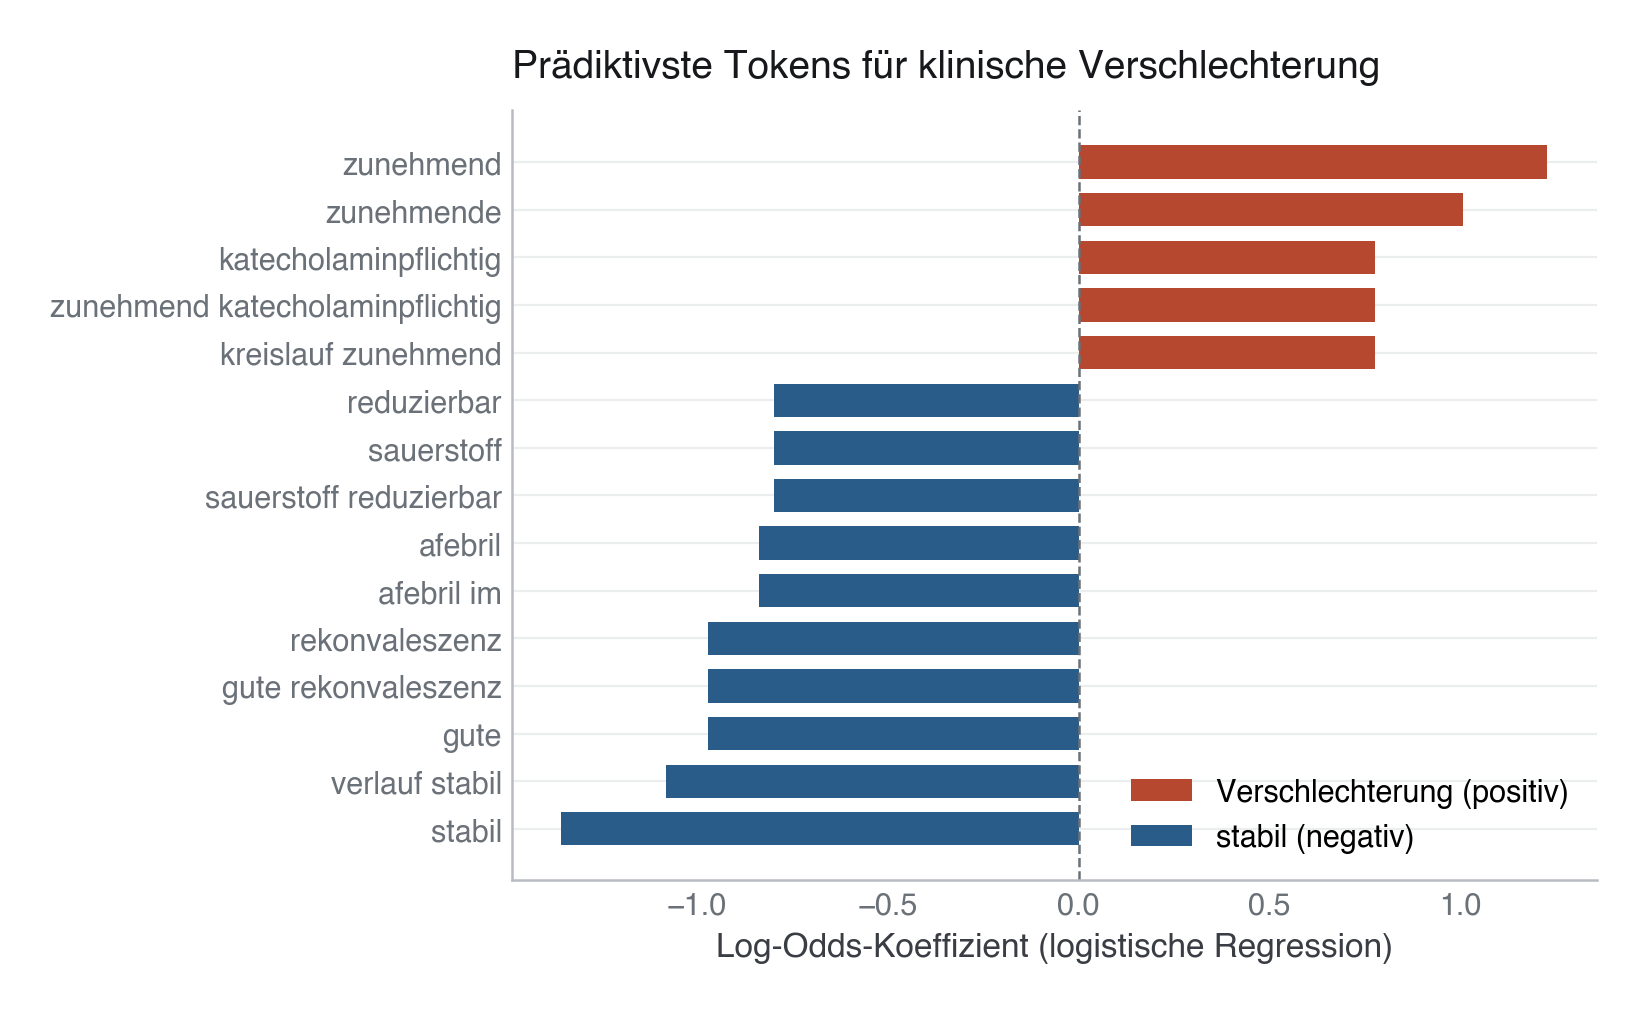
Erzeugt von fig_top_tokens() in module/31-klinische-texte-llm/code/figures.py, Zeile 48–77.
Python
Python-Code: in eine Datei mit Endung
.py schreiben und mit dem ▶-Knopf in VS Code ausführen – oder Zeile für Zeile in die Python-Konsole. Setzt die in Modul 02 eingerichtete Umgebung voraus.def fig_top_tokens(pipe: Pipeline) -> None: """Horizontal signed bar chart of the 15 most predictive tokens.""" feature_names = pipe.named_steps["tfidf"].get_feature_names_out() coef = pipe.named_steps["model"].coef_[0] n = 15 idx = np.argsort(np.abs(coef))[::-1][:n] tokens = feature_names[idx] values = coef[idx] # Sort by coefficient for visual clarity (negative → positive) order = np.argsort(values) tokens_sorted = tokens[order] values_sorted = values[order] colors = [EVENT if v > 0 else PRIMARY for v in values_sorted] fig, ax = plt.subplots(figsize=(7, 5)) bars = ax.barh(tokens_sorted, values_sorted, color=colors, height=0.7) ax.axvline(0, color=SECONDARY, lw=0.9, ls="--") ax.set_xlabel("Log-Odds-Koeffizient (logistische Regression)") ax.set_title("Prädiktivste Tokens für klinische Verschlechterung") # Legend patches from matplotlib.patches import Patch legend_elements = [ Patch(facecolor=EVENT, label="Verschlechterung (positiv)"), Patch(facecolor=PRIMARY, label="stabil (negativ)"), ] ax.legend(handles=legend_elements, loc="lower right") save(fig, ASSETS / "top_tokens.png")