32 · Modelleinsatz, Monitoring und Governance
drift_monitoring.png
Abbildung · Quellcode
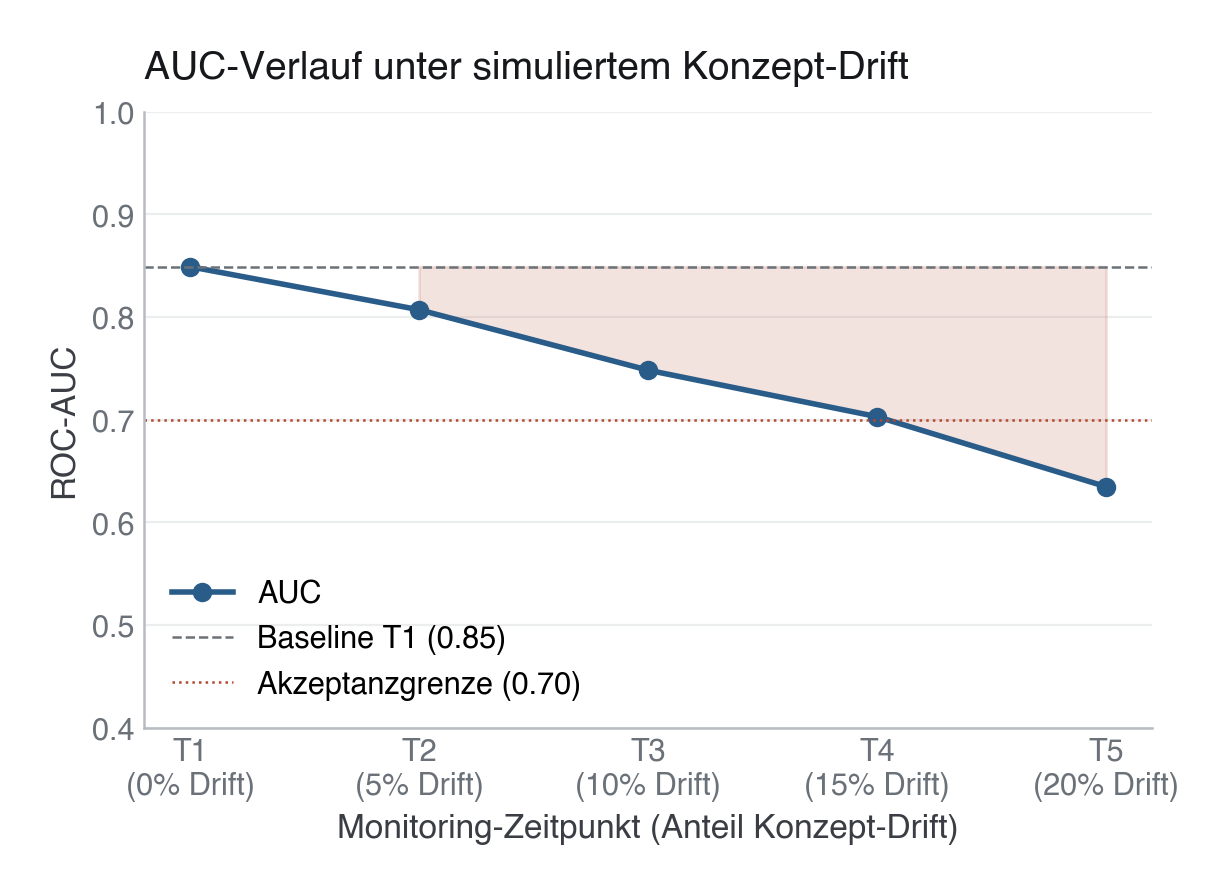
Erzeugt von fig_drift_monitoring() in module/32-einsatz-governance/code/figures.py, Zeile 86–113.
Python
Python-Code: in eine Datei mit Endung
.py schreiben und mit dem ▶-Knopf in VS Code ausführen – oder Zeile für Zeile in die Python-Konsole. Setzt die in Modul 02 eingerichtete Umgebung voraus.def fig_drift_monitoring(pipe: Pipeline, X_test: pd.Series, y_test: pd.Series) -> None: """Line plot of AUC vs. simulated concept drift level over 5 monitoring periods.""" rng = np.random.default_rng(SEED) aucs = [] for flip_rate in DRIFT_FLIP_RATES: y_drifted = simulate_concept_drift(y_test, flip_rate, rng) proba = pipe.predict_proba(X_test)[:, 1] aucs.append(roc_auc_score(y_drifted, proba)) labels = [f"T{i+1}\n({fr:.0%} Drift)" for i, fr in enumerate(DRIFT_FLIP_RATES)] fig, ax = plt.subplots(figsize=(6.5, 4)) ax.plot(range(len(DRIFT_FLIP_RATES)), aucs, marker="o", color=PRIMARY, lw=2, label="AUC") ax.axhline(aucs[0], color=SECONDARY, lw=0.9, ls="--", label=f"Baseline T1 ({aucs[0]:.2f})") ax.axhline(0.70, color=EVENT, lw=0.9, ls=":", label="Akzeptanzgrenze (0.70)") ax.fill_between(range(len(DRIFT_FLIP_RATES)), aucs, aucs[0], where=[a < aucs[0] for a in aucs], alpha=0.15, color=EVENT) ax.set_xticks(range(len(DRIFT_FLIP_RATES))) ax.set_xticklabels(labels) ax.set_ylim(0.4, 1.0) ax.set_xlabel("Monitoring-Zeitpunkt (Anteil Konzept-Drift)") ax.set_ylabel("ROC-AUC") ax.set_title("AUC-Verlauf unter simuliertem Konzept-Drift") ax.legend(loc="lower left") save(fig, ASSETS / "drift_monitoring.png")