32 · Modelleinsatz, Monitoring und Governance
subgruppen_auc.png
Abbildung · Quellcode
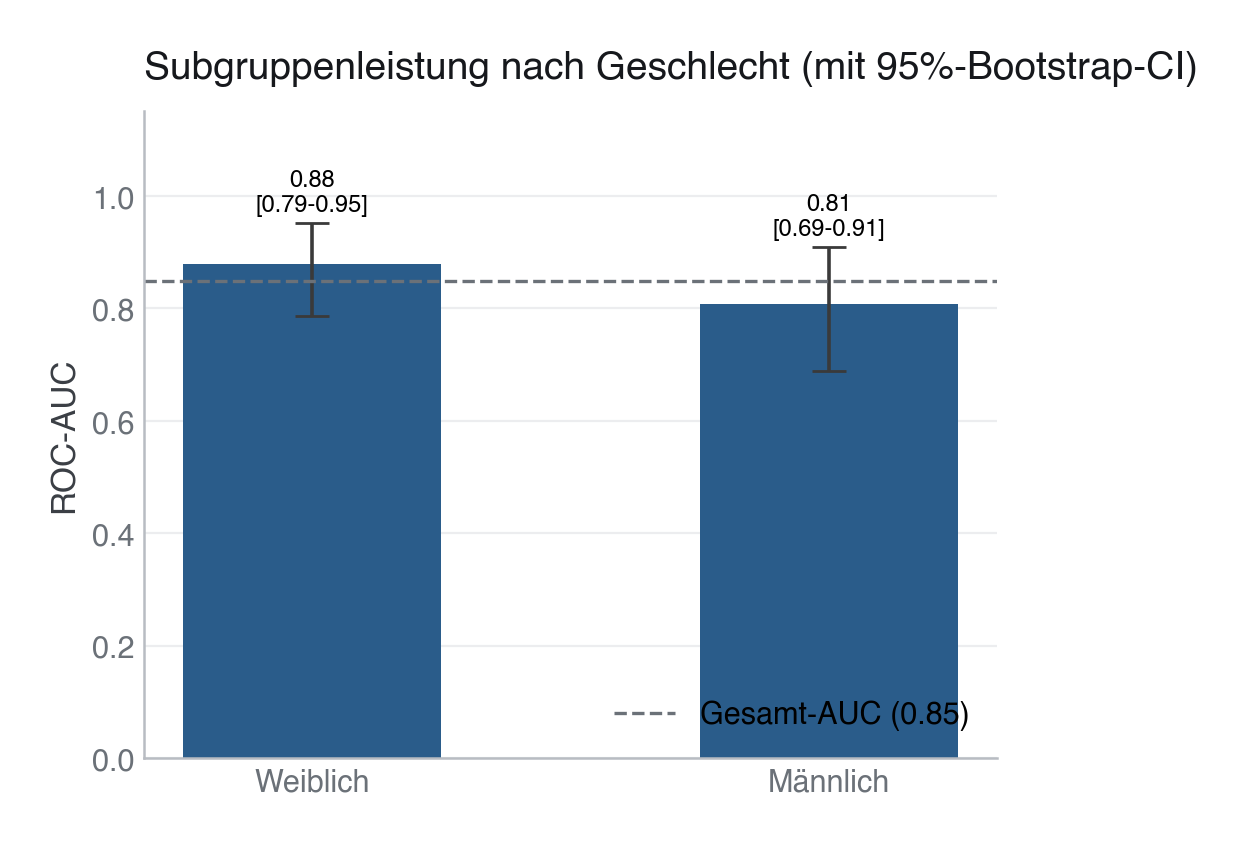
Erzeugt von fig_subgruppen_auc() in module/32-einsatz-governance/code/figures.py, Zeile 116–169.
Python
Python-Code: in eine Datei mit Endung
.py schreiben und mit dem ▶-Knopf in VS Code ausführen – oder Zeile für Zeile in die Python-Konsole. Setzt die in Modul 02 eingerichtete Umgebung voraus.def fig_subgruppen_auc(pipe: Pipeline) -> None: """Bar chart of AUC by Geschlecht subgroup, with bootstrap 95%-CI error bars.""" cohort = load_cohort() cohort["geschlecht_clean"] = cohort["geschlecht"].replace({"w": "weiblich"}) notes = load_notes() merged = notes.merge( cohort[["patient_id", "geschlecht_clean"]], on="patient_id", how="left" ) _, test_idx = train_test_split( merged.index, test_size=0.25, stratify=merged[TARGET], random_state=SEED ) test_data = merged.loc[test_idx].copy() proba_all = pipe.predict_proba(test_data["notiz"])[:, 1] overall_auc = roc_auc_score(test_data[TARGET], proba_all) # Display labels with correct German umlauts — "maennlich" is only the # internal data-encoding value, not what should appear on the chart. display_name = {"weiblich": "Weiblich", "maennlich": "Männlich"} groups, aucs, err_lo, err_hi, cis = [], [], [], [], [] for group in ["weiblich", "maennlich"]: mask = test_data["geschlecht_clean"] == group if mask.sum() < 5: continue y_g = test_data.loc[mask, TARGET].to_numpy() p_g = proba_all[mask.values] auc_g = roc_auc_score(y_g, p_g) lo, hi = bootstrap_auc_ci(y_g, p_g) groups.append(display_name[group]) aucs.append(auc_g) err_lo.append(auc_g - lo) err_hi.append(hi - auc_g) cis.append((lo, hi)) # Flag a bar only if its CI does NOT overlap the overall AUC — a point # estimate more than 0.05 away from the mean can still be pure noise if # the CI is wide, so colour-coding must be based on the interval, not # the point estimate alone. colors = [EVENT if not (lo <= overall_auc <= hi) else PRIMARY for lo, hi in cis] fig, ax = plt.subplots(figsize=(5.5, 4.2)) ax.bar(groups, aucs, color=colors, width=0.5, yerr=[err_lo, err_hi], capsize=6, ecolor="#3A3A3A", error_kw={"lw": 1.3}) ax.axhline(overall_auc, color=SECONDARY, lw=1.2, ls="--", label=f"Gesamt-AUC ({overall_auc:.2f})") for i, (g, a, (lo, hi)) in enumerate(zip(groups, aucs, cis)): ax.text(i, hi + 0.02, f"{a:.2f}\n[{lo:.2f}-{hi:.2f}]", ha="center", fontsize=8.5) ax.set_ylim(0, 1.15) ax.set_ylabel("ROC-AUC") ax.set_title("Subgruppenleistung nach Geschlecht (mit 95%-Bootstrap-CI)") ax.legend(loc="lower right") save(fig, ASSETS / "subgruppen_auc.png")