33 · Retrieval-Augmented Generation und Leitlinien-Q&A
rag_pipeline.png
Abbildung · Quellcode
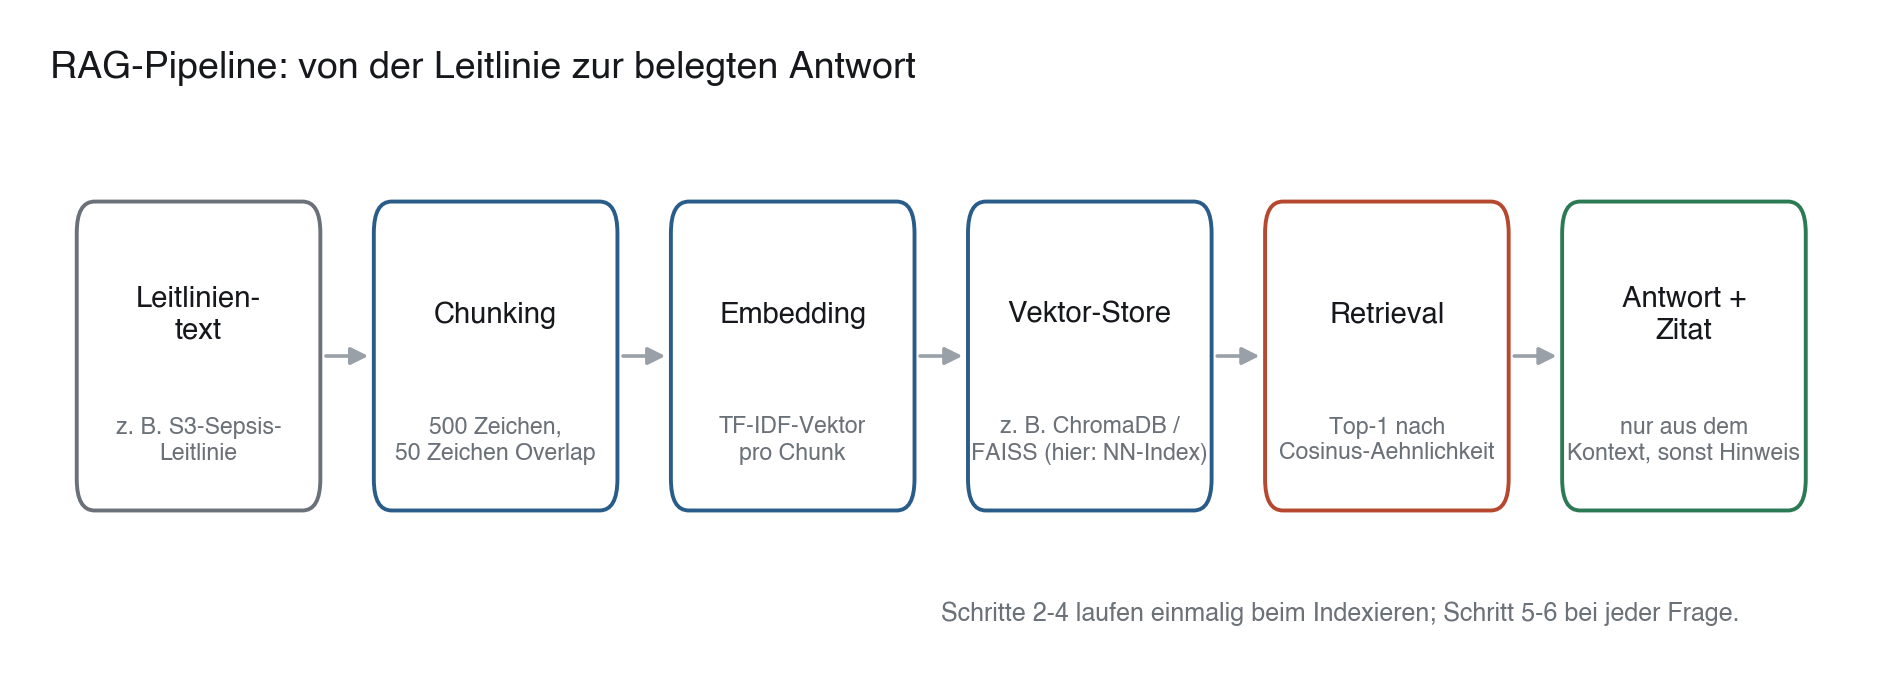
Erzeugt von fig_rag_pipeline() in module/33-rag-llm-pipelines/code/figures.py, Zeile 34–62.
Python
Python-Code: in eine Datei mit Endung
.py schreiben und mit dem ▶-Knopf in VS Code ausführen – oder Zeile für Zeile in die Python-Konsole. Setzt die in Modul 02 eingerichtete Umgebung voraus.def fig_rag_pipeline() -> None: fig, ax = plt.subplots(figsize=(11.5, 3.4)) ax.set_xlim(0, len(STEPS)) ax.set_ylim(0, 1) ax.axis("off") box_w, box_h = 0.78, 0.55 y_c = 0.55 for i, (title, sub, color) in enumerate(STEPS): x_c = i + 0.5 box = FancyBboxPatch((x_c - box_w / 2, y_c - box_h / 2), box_w, box_h, boxstyle="round,pad=0.02,rounding_size=0.06", linewidth=1.4, edgecolor=color, facecolor="white", zorder=3) ax.add_patch(box) ax.text(x_c, y_c + 0.08, title, ha="center", va="center", fontsize=10.5, fontweight="bold", color="#16181C", zorder=4) ax.text(x_c, y_c - 0.16, sub, ha="center", va="center", fontsize=8.3, color="#6B7178", zorder=4) if i < len(STEPS) - 1: arrow = FancyArrowPatch((x_c + box_w / 2 + 0.02, y_c), (x_c + 1 - box_w / 2 - 0.02, y_c), arrowstyle="-|>", mutation_scale=13, linewidth=1.3, color="#9AA0A8", zorder=2) ax.add_patch(arrow) ax.text(0.5, 0.06, "Schritte 2-4 laufen einmalig beim Indexieren; Schritt 5-6 bei jeder Frage.", ha="left", va="center", fontsize=9, color="#6B7178", transform=ax.transAxes) ax.set_title("RAG-Pipeline: von der Leitlinie zur belegten Antwort", loc="left", fontsize=13.5, fontweight="bold", color="#16181C", y=1.02) save(fig, ASSETS / "rag_pipeline.png")